
Funnel Analysis and Network Visualisation with ING
Understanding how users navigate websites can be very hard. Some approaches use funnel analysis, calculating conversion rates on specific user behaviors, or sankey diagrams. However both techniques fail when you want to understand general user behaviour in websites with more than tens of pages. With Graphext, we have created a network visualization of how users navigate in hundreds of pages, and we are able to correlate their navigation patterns with specific user profiles to explain different types of behaviours.
We have worked with the Digital and Sales Strategy Department from ING to extract insights from their website navigation data. They wanted to understand how customers that had bought a product navigated differently from those that had not, see their navigation paths and identify other factors that may have impacted their purchase decisions. The challenge is that ING website has hundreds of pages that a client can visit, and it is challenging to correlate navigation data and client characteristics for analysis. ING relied on Graphext to deliver an innovative solution to solve this problem. To illustrate this example, all data in this post is anonymised.
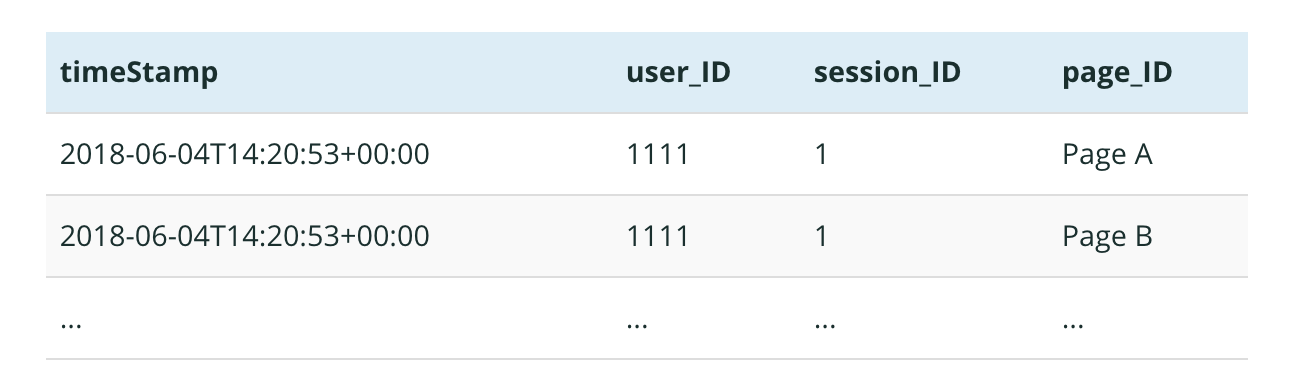
We started by using navigation data in a “log” format, meaning a list of record per user visit in a webpage containing timestamp, user ID, page ID and session ID. You can easily extract this type of data from any webpage analytics service. We also had a “user dictionary” with information associated to each user ID, and a “page dictionary” with information associated to each page ID.
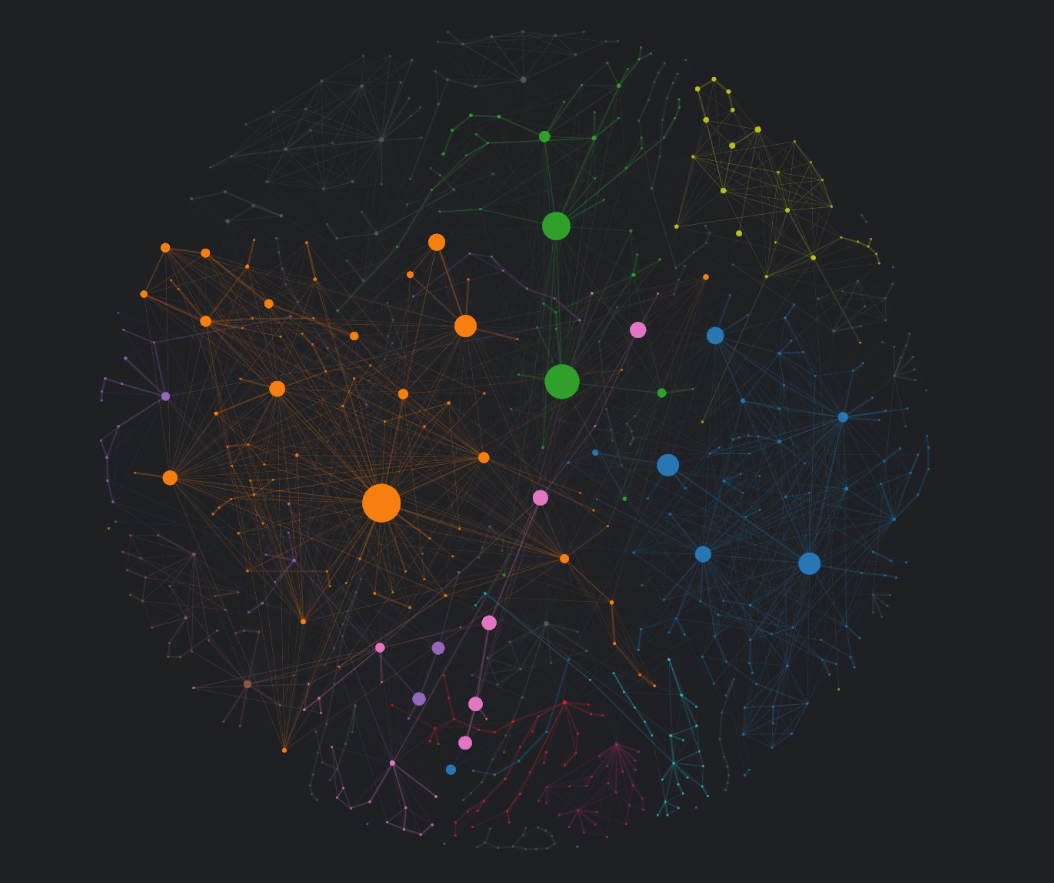
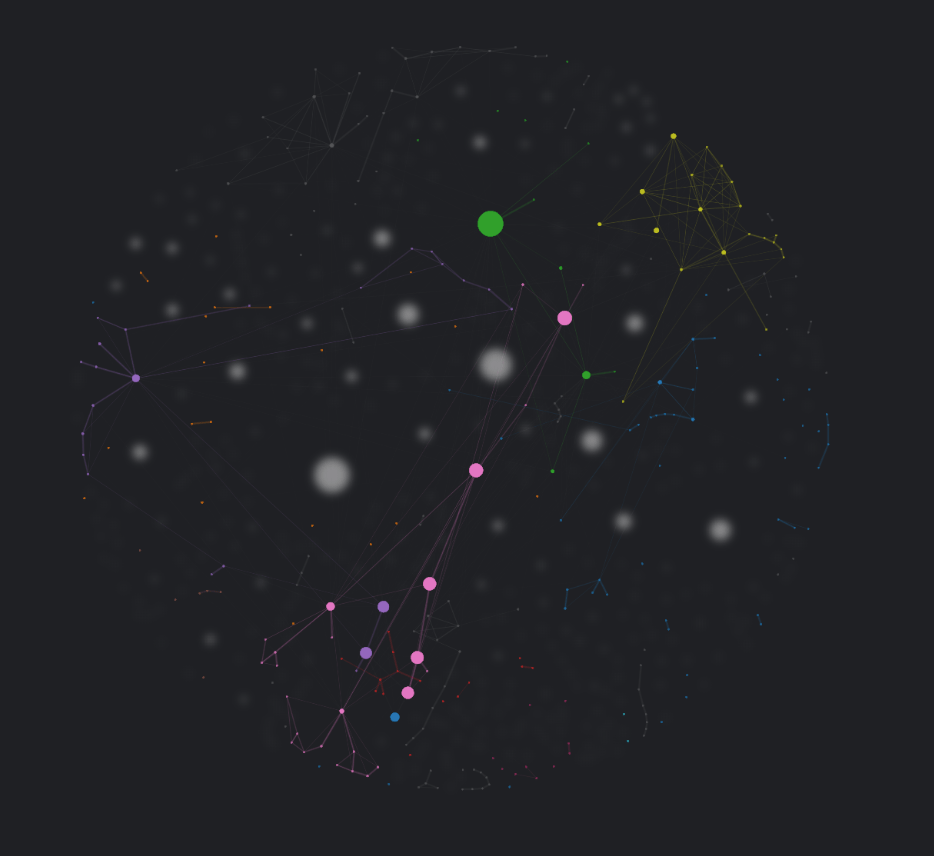
Using Graphext, we are able to visualise the network of the navigation of all the users. Each node is a page, and the links between nodes represent their connection to other pages. The size of the node represents the number of users visited that page. At a first glance, we are able to identify the main pages and the main groups of routes, represented with different colours using unsupervised clustering.
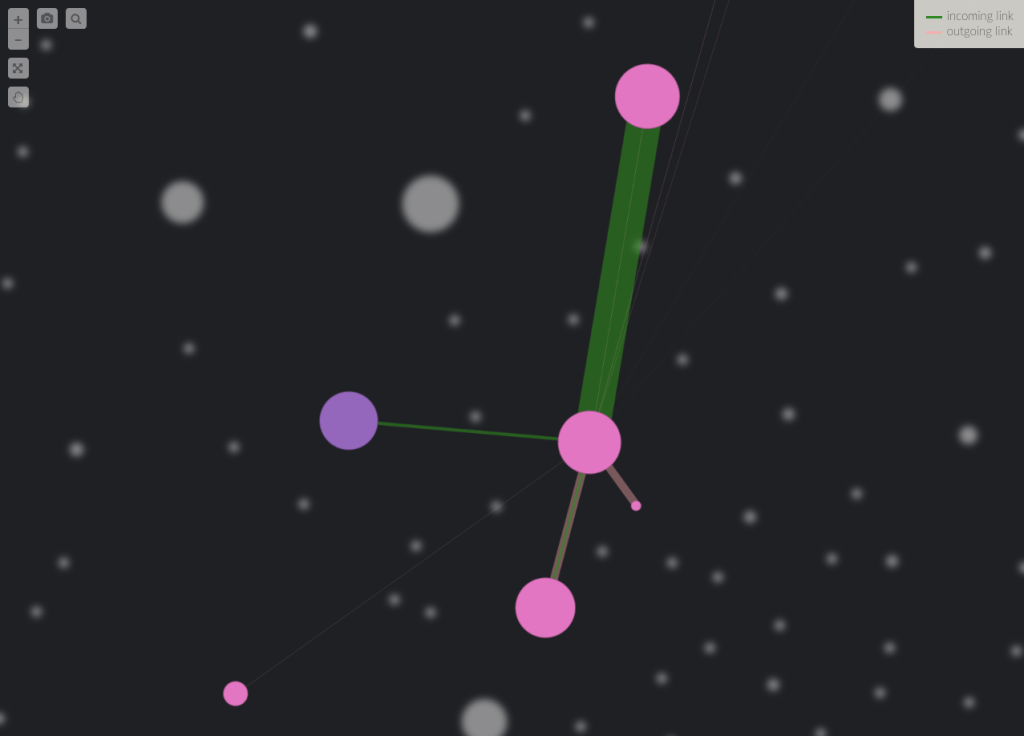
Double clicking on a specific node, we can see the incoming and outgoing links to the correspondent pages, the width of the link is proportional to the number of visits from each node . We can also switch to “only incoming” or “only outgoing” nodes.
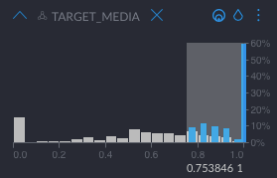
Since we have all the user variables of these pages, we can easily filter “routes” based on different user behaviour. For example, we have a target variable that we want to analyse, such as “the user has bought product A”. We just filter by this variable in Graphext, and get the routes with more than 75% of people who have bought the product.
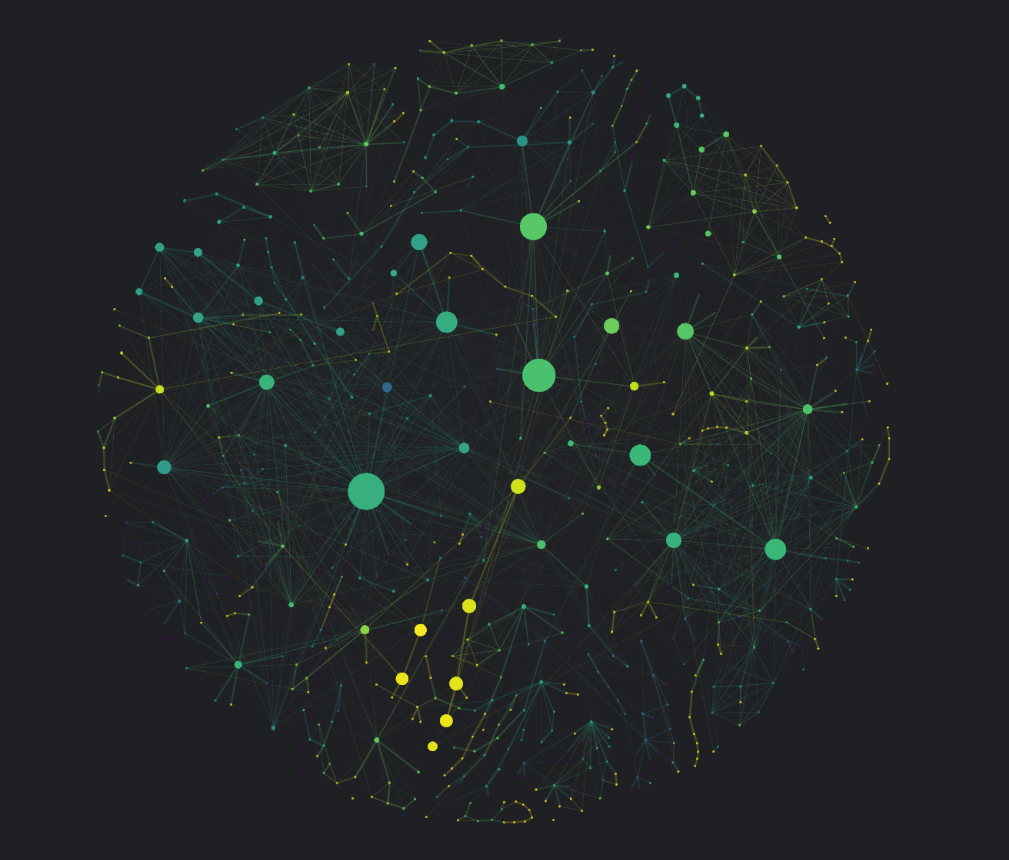
We can also visualise the distribution of the variable in the whole network and use it as a heat map, helping us find the main funnels of clients who have bough the product. We can identify routes that may not be related, but have a high proportion of clients in our target. For example, clients that have bought the target product probably have read blog posts, or come from webpages of other products. We can also detect bottlenecks or dead ends of traffic for that specific client behaviour.
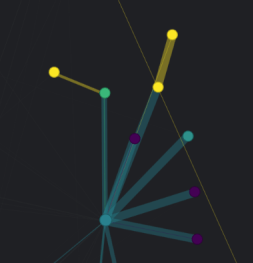
For example, from the central node highlighted in green at the bottom of the image, users can move to six pages. Users that move to the pages on the top have a much higher probability of purchasing (yellow in the heat map) than those moving to the rest of the pages. So probably, you’ll want to facilitate the access to the pages in the yellow nodes.
In summary, the network representation helps you visualise all possible navigation paths at once, so you can build heat maps to identify characteristics of the clients browsing those pages. It helps you overcome the tunnel effect of a traditional funnel analysis and solves the sankey issue of visualising hundreds of connections. In addition, with the exploratory interaction through Graphext, you can easily identify navigation patterns of different customer segments based on their characteristics.