
Alexa Amazon Reviews
If you want to succeed with your product in the market you have to listen to what your customers say. Of course, one could check the ratings and conclude that the product is either liked or not. You could compare your product to the ones from your competitors and if you beat them there is nothing more to worry about right? It is probably not that easy. Really listening to your customers means to understand the drivers behind a rating. Having an understanding of different narratives can help you to develop just the right features to boost your sales.
Using a dataset from Kaggle that holds more than 3,000 Amazon reviews about Alexa, we are going to show you how customer oriented product development would look like with Graphext.
We want to extract unbiased insights, so what we do is feed the dataset of reviews to Graphext and let it do all the work for us. Go, grab a coffee, get your team around your desk, the narratives are being extracted. Once the clustering is finished, we find a graph in which each node represents a review and each link a content similarity between two reviews. Reviews with many links between each other form a distinctive cluster which is colored respectively.
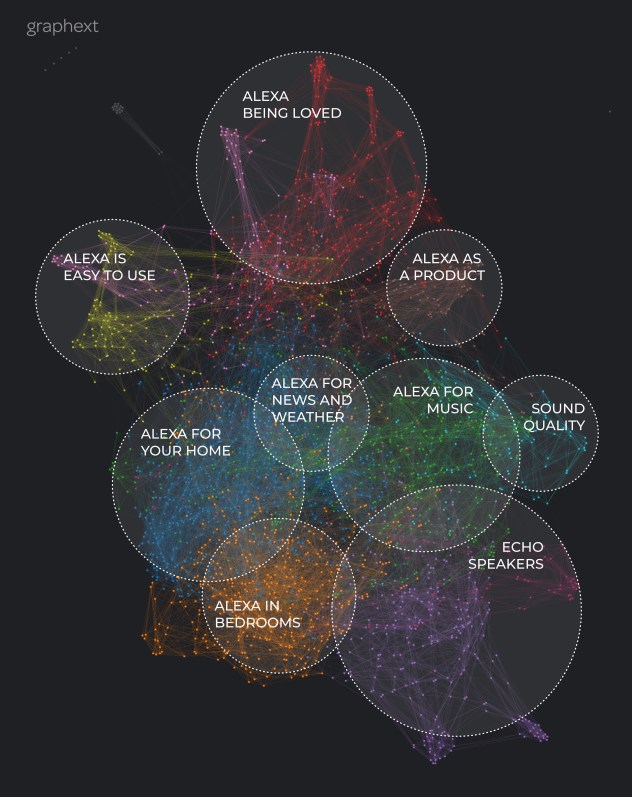
The main groups of topics can be summarized as shown in the graphic. Many reviews simply state how great Alexa is and how much in love they are with the product. Others go more into detail and mention the product’s characteristics or different use cases in which it helps them. For example as an alarm clock in the bedroom, for playing music or report the news and the weather. For some people Alexa became an irreplaceable part of their home. Very common are also reviews about the Echo speaker and the sound quality.
Well, so now that we know about the main stories and keywords, how can we make use of them? One way could be, to go into each cluster, analyze each of the reviews separately and maybe by the end of the week you will have an understanding what causes dissatisfaction. I can tell you, there is a more convenient way to do it.
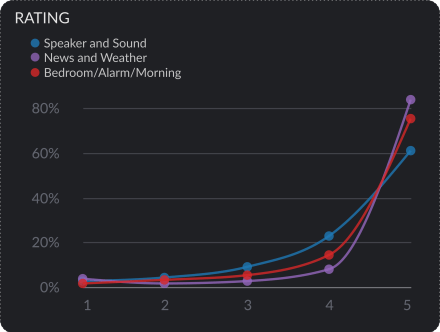
You can directly compare clusters and collections and understand their different distributions of reviews. If we take a look at the three stories “Speaker and Sound”, “News and Weather” and “Bedroom and Alarm Clock” we can immediately see where Alexa has to improve. People who use Alexa for the news and weather reports gave 84% five star ratings, those who use it for its speaker and to listen to music gave only 61% five star ratings. 16% of the music lovers left ratings between 1 or 3 stars whereas only 8% of the news and weather users left such a bad review.
This analysis clearly points out use cases in which amazon has to improve Alexa. Besides that, knowing for what Alexa is being liked most, can help you to launch suitable marketing strategies addressing particular product features.