
Understanding Employee Behaviour
Why do people act the way they do? Why do they buy products, quit their jobs, or change partners? Many of these motives can be inducted from people’s behaviour, and these behaviours are reflected in data.
Companies have lots of data about their clients, employees, suppliers. Let’s put that data to work to do some smart data discovery and see what we could learn. We will demonstrate an example using a dataset from IBM´s Human Resources department that we found in Kaggle
In this dataset, each row represents an employee and the columns are different variables that describe them. These variables include both categorical and quantitative information. Let’s upload the dataset to Graphext and take a look at it.
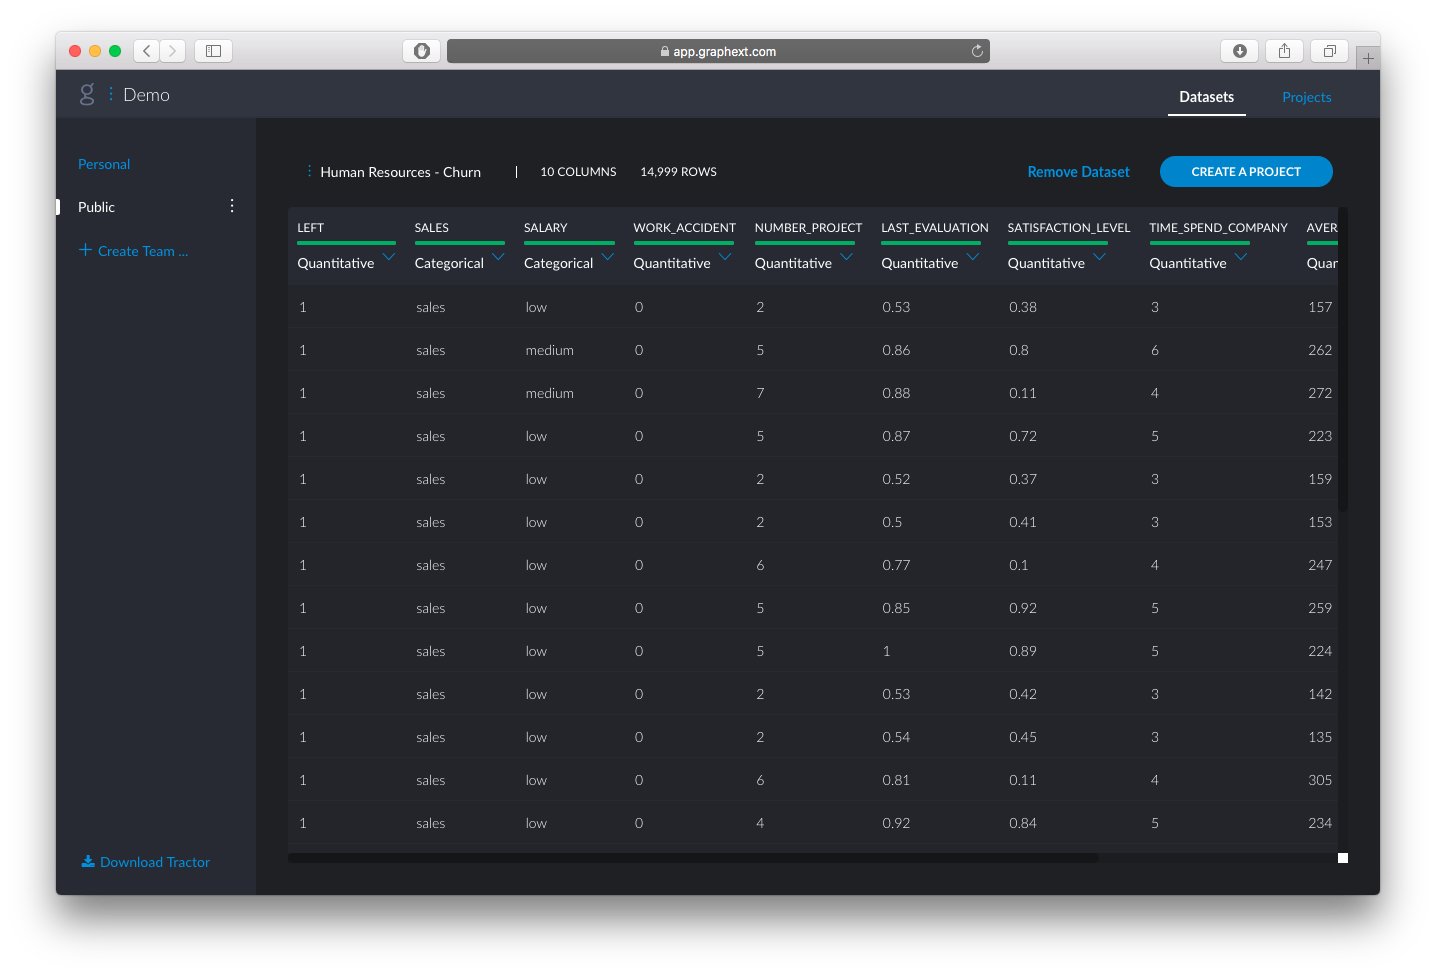
In this example, we want to analyse why employees left. In the binary variable “LEFT” column from the original data set, 1 signifies that an employee has left, 0 signifies that they have stayed. Excluding this “Target Variable” column from our analysis, we can then use the rest of the variables to observe the behaviour patterns that may or may not lead to talent attrition. Let’s take a look at the output.
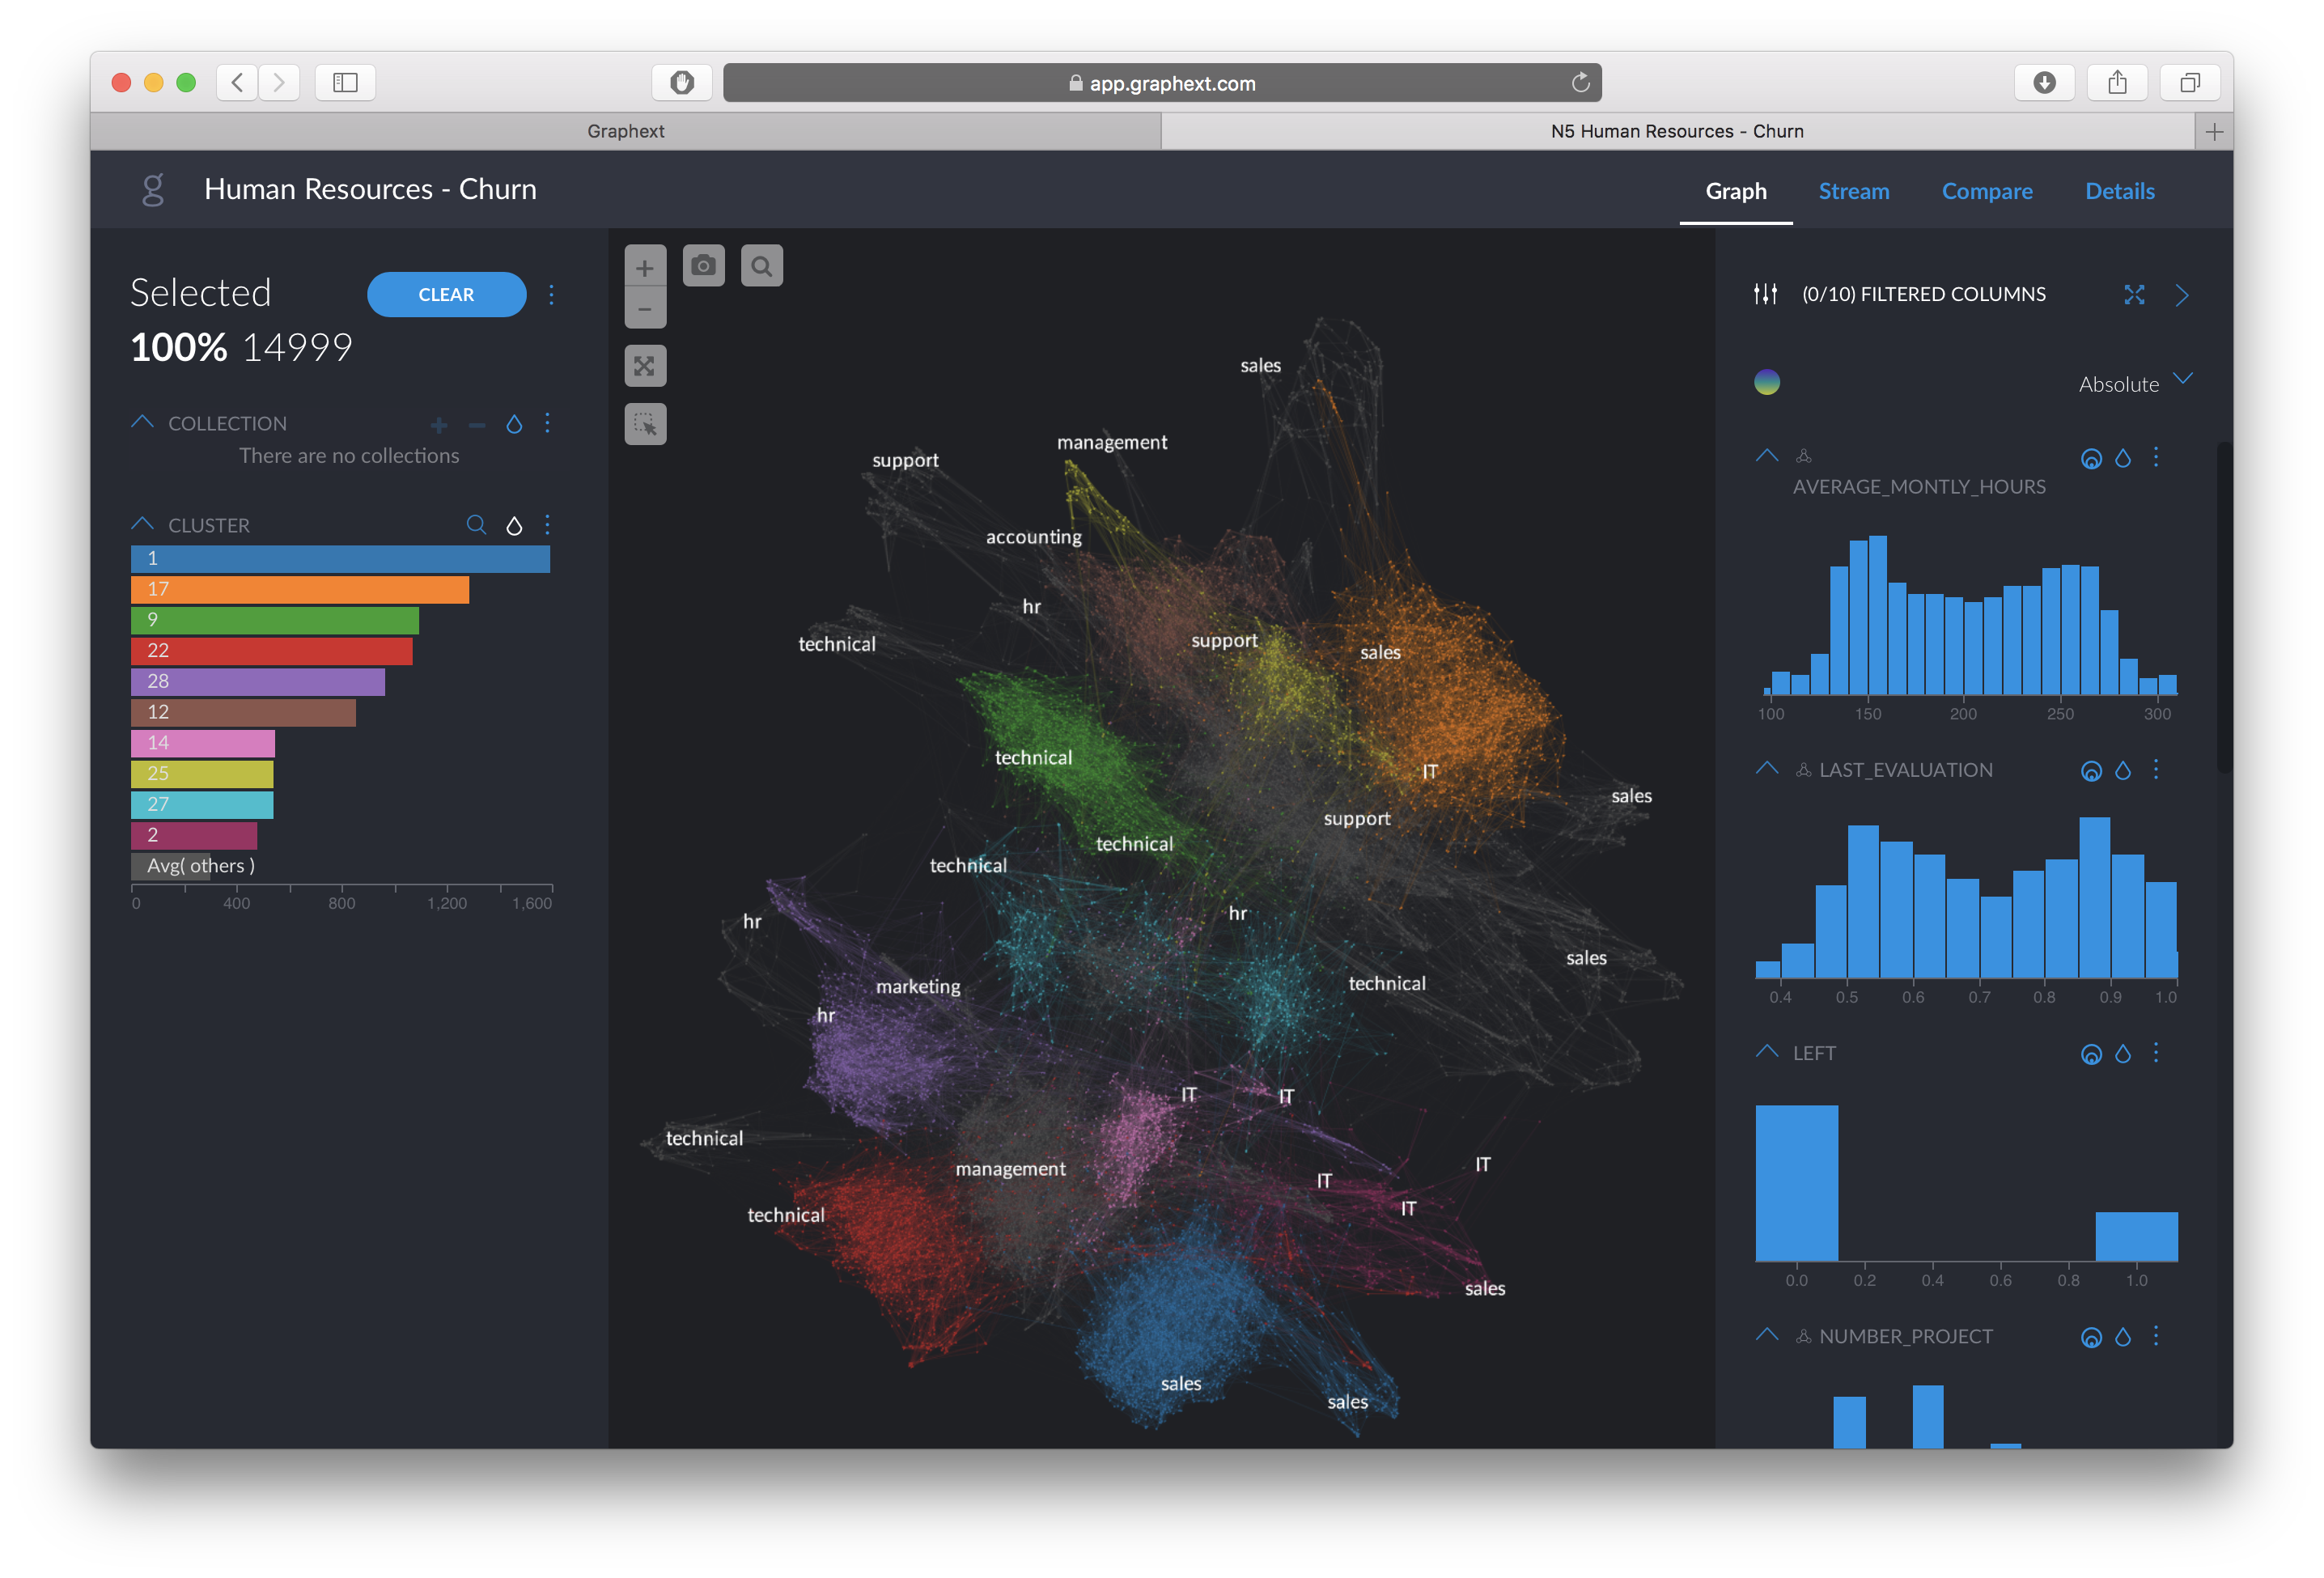
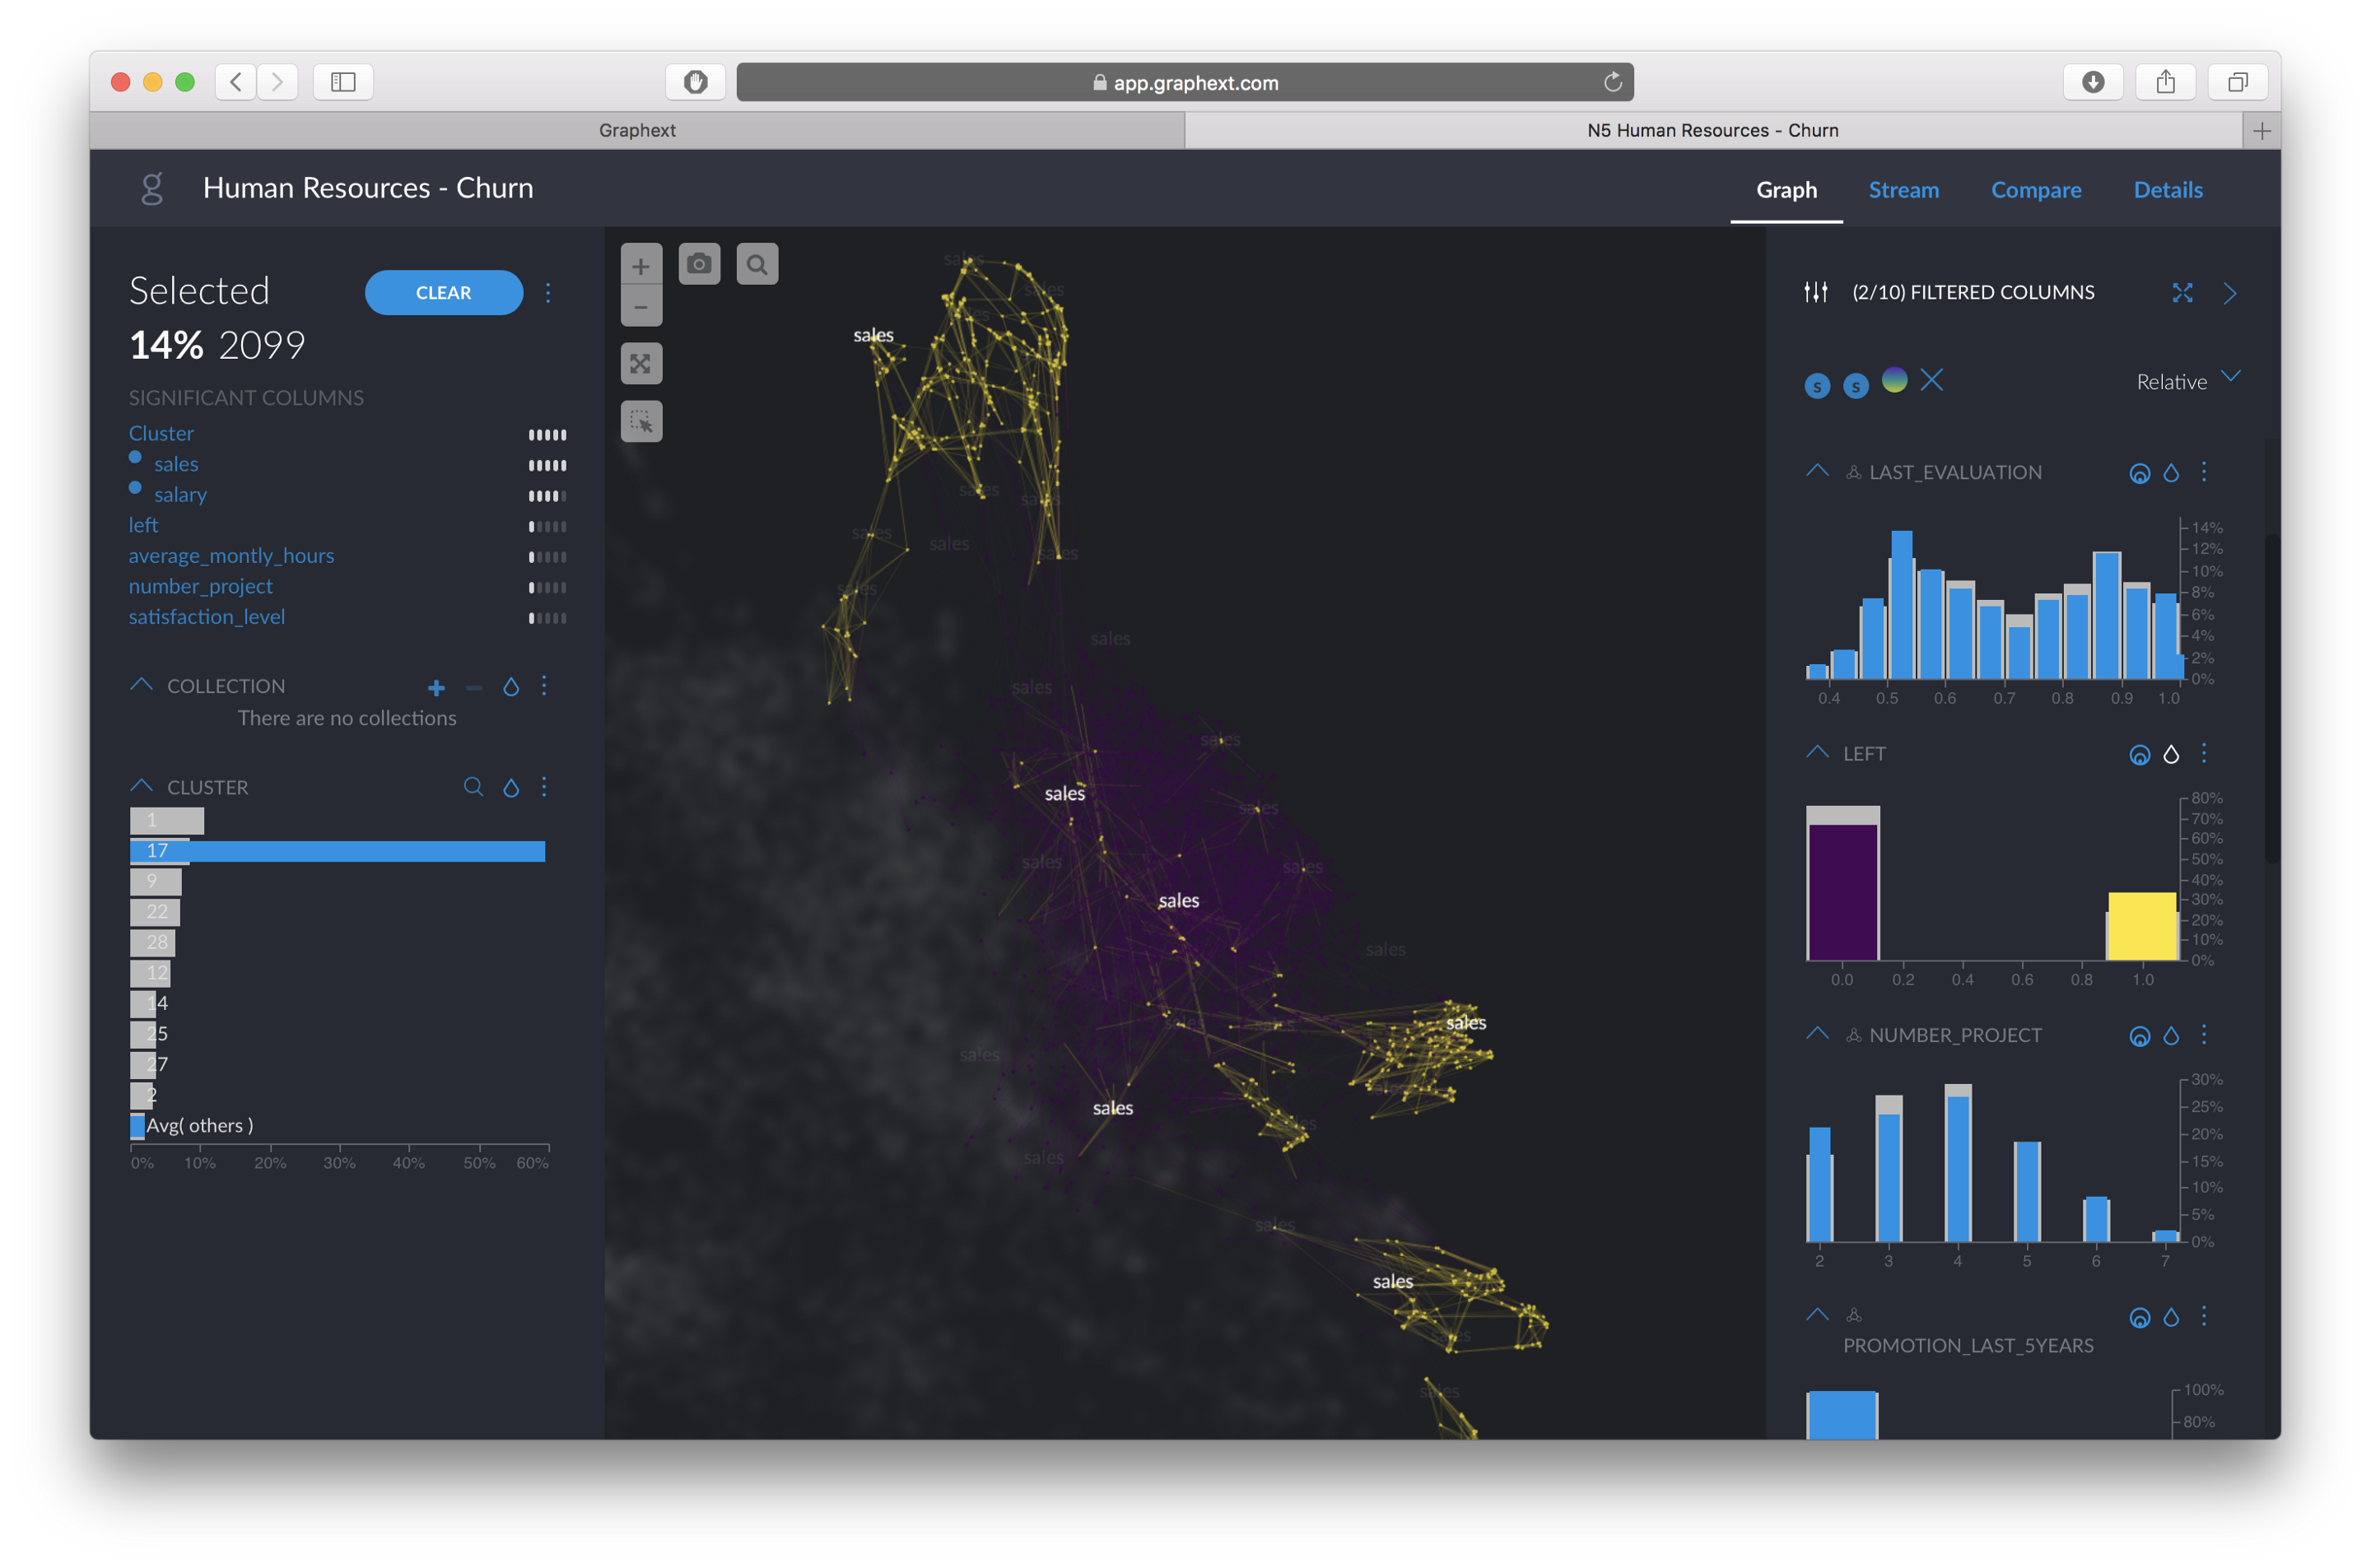
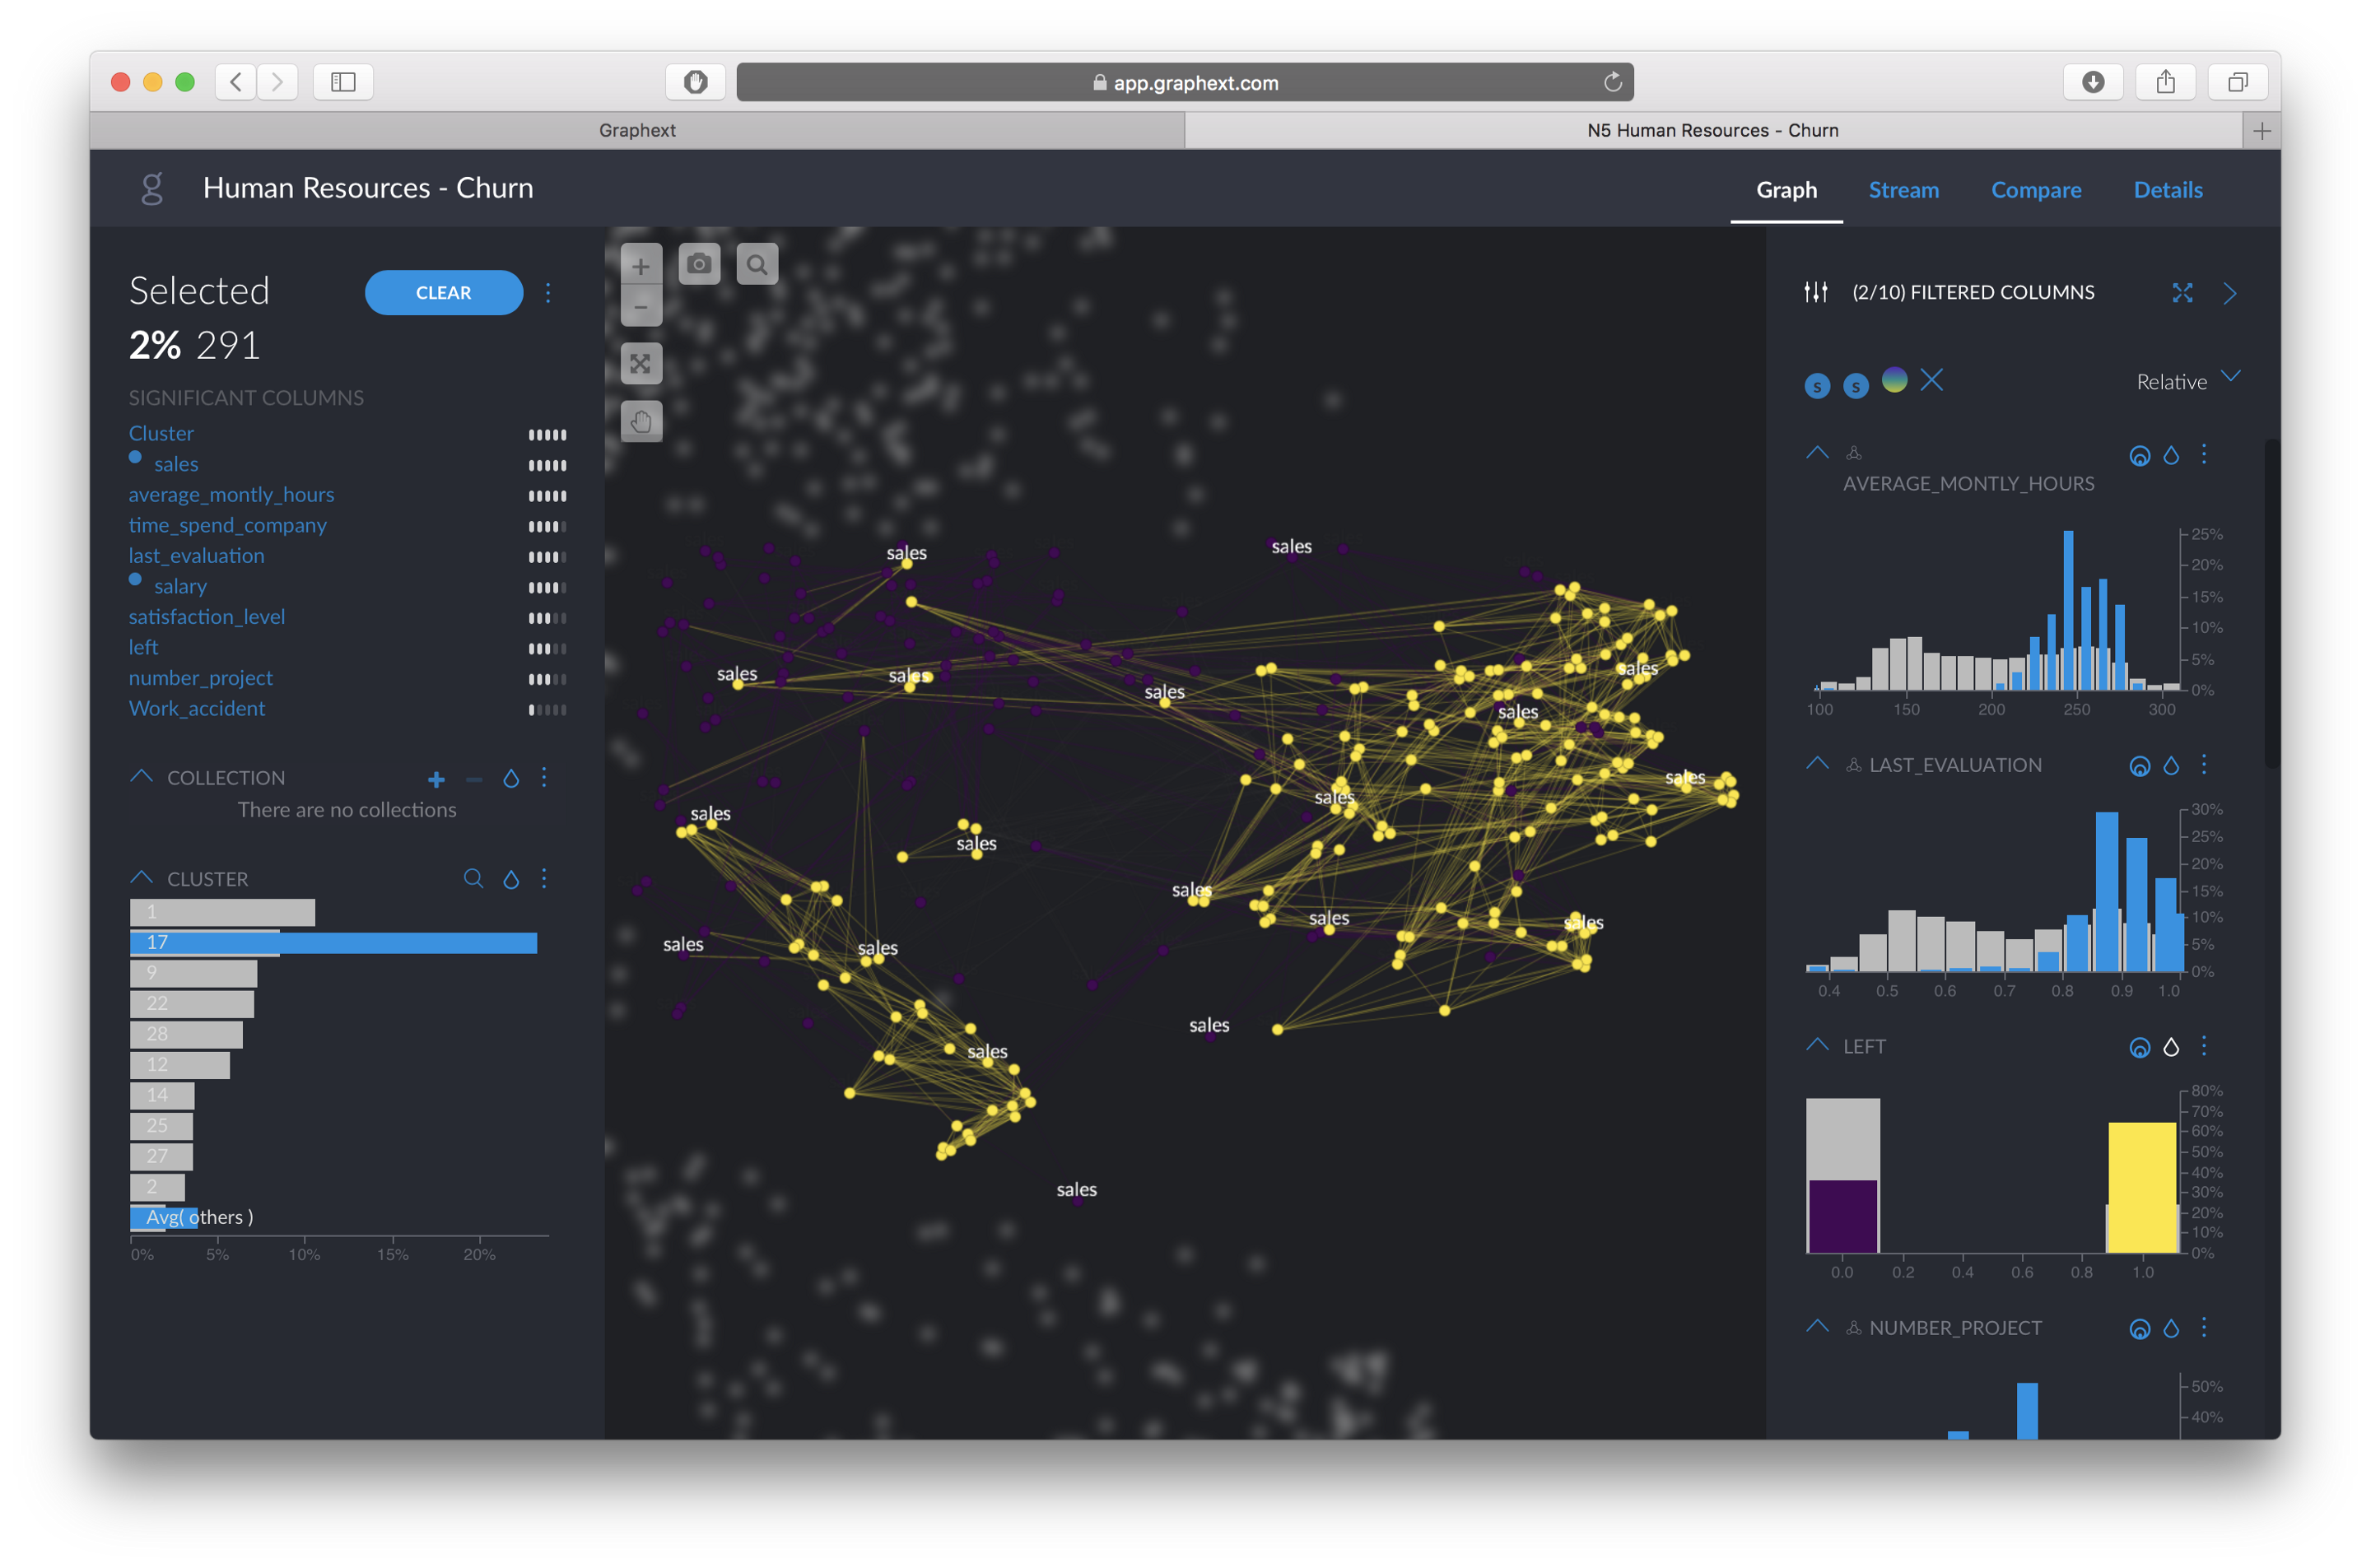
In this visualization, each node is an employee. Nodes similar to each are located closer, and vice versa. Thus, we can see a datamap with different patterns. We have created the network using our own advanced method of dimensional reduction, and on top we run clustering algorithms of community detection in networks.
As we have a target variable that we want to explain, coloring the dataset by the variable “LEFT” lets us see how it is distributed amongst values.
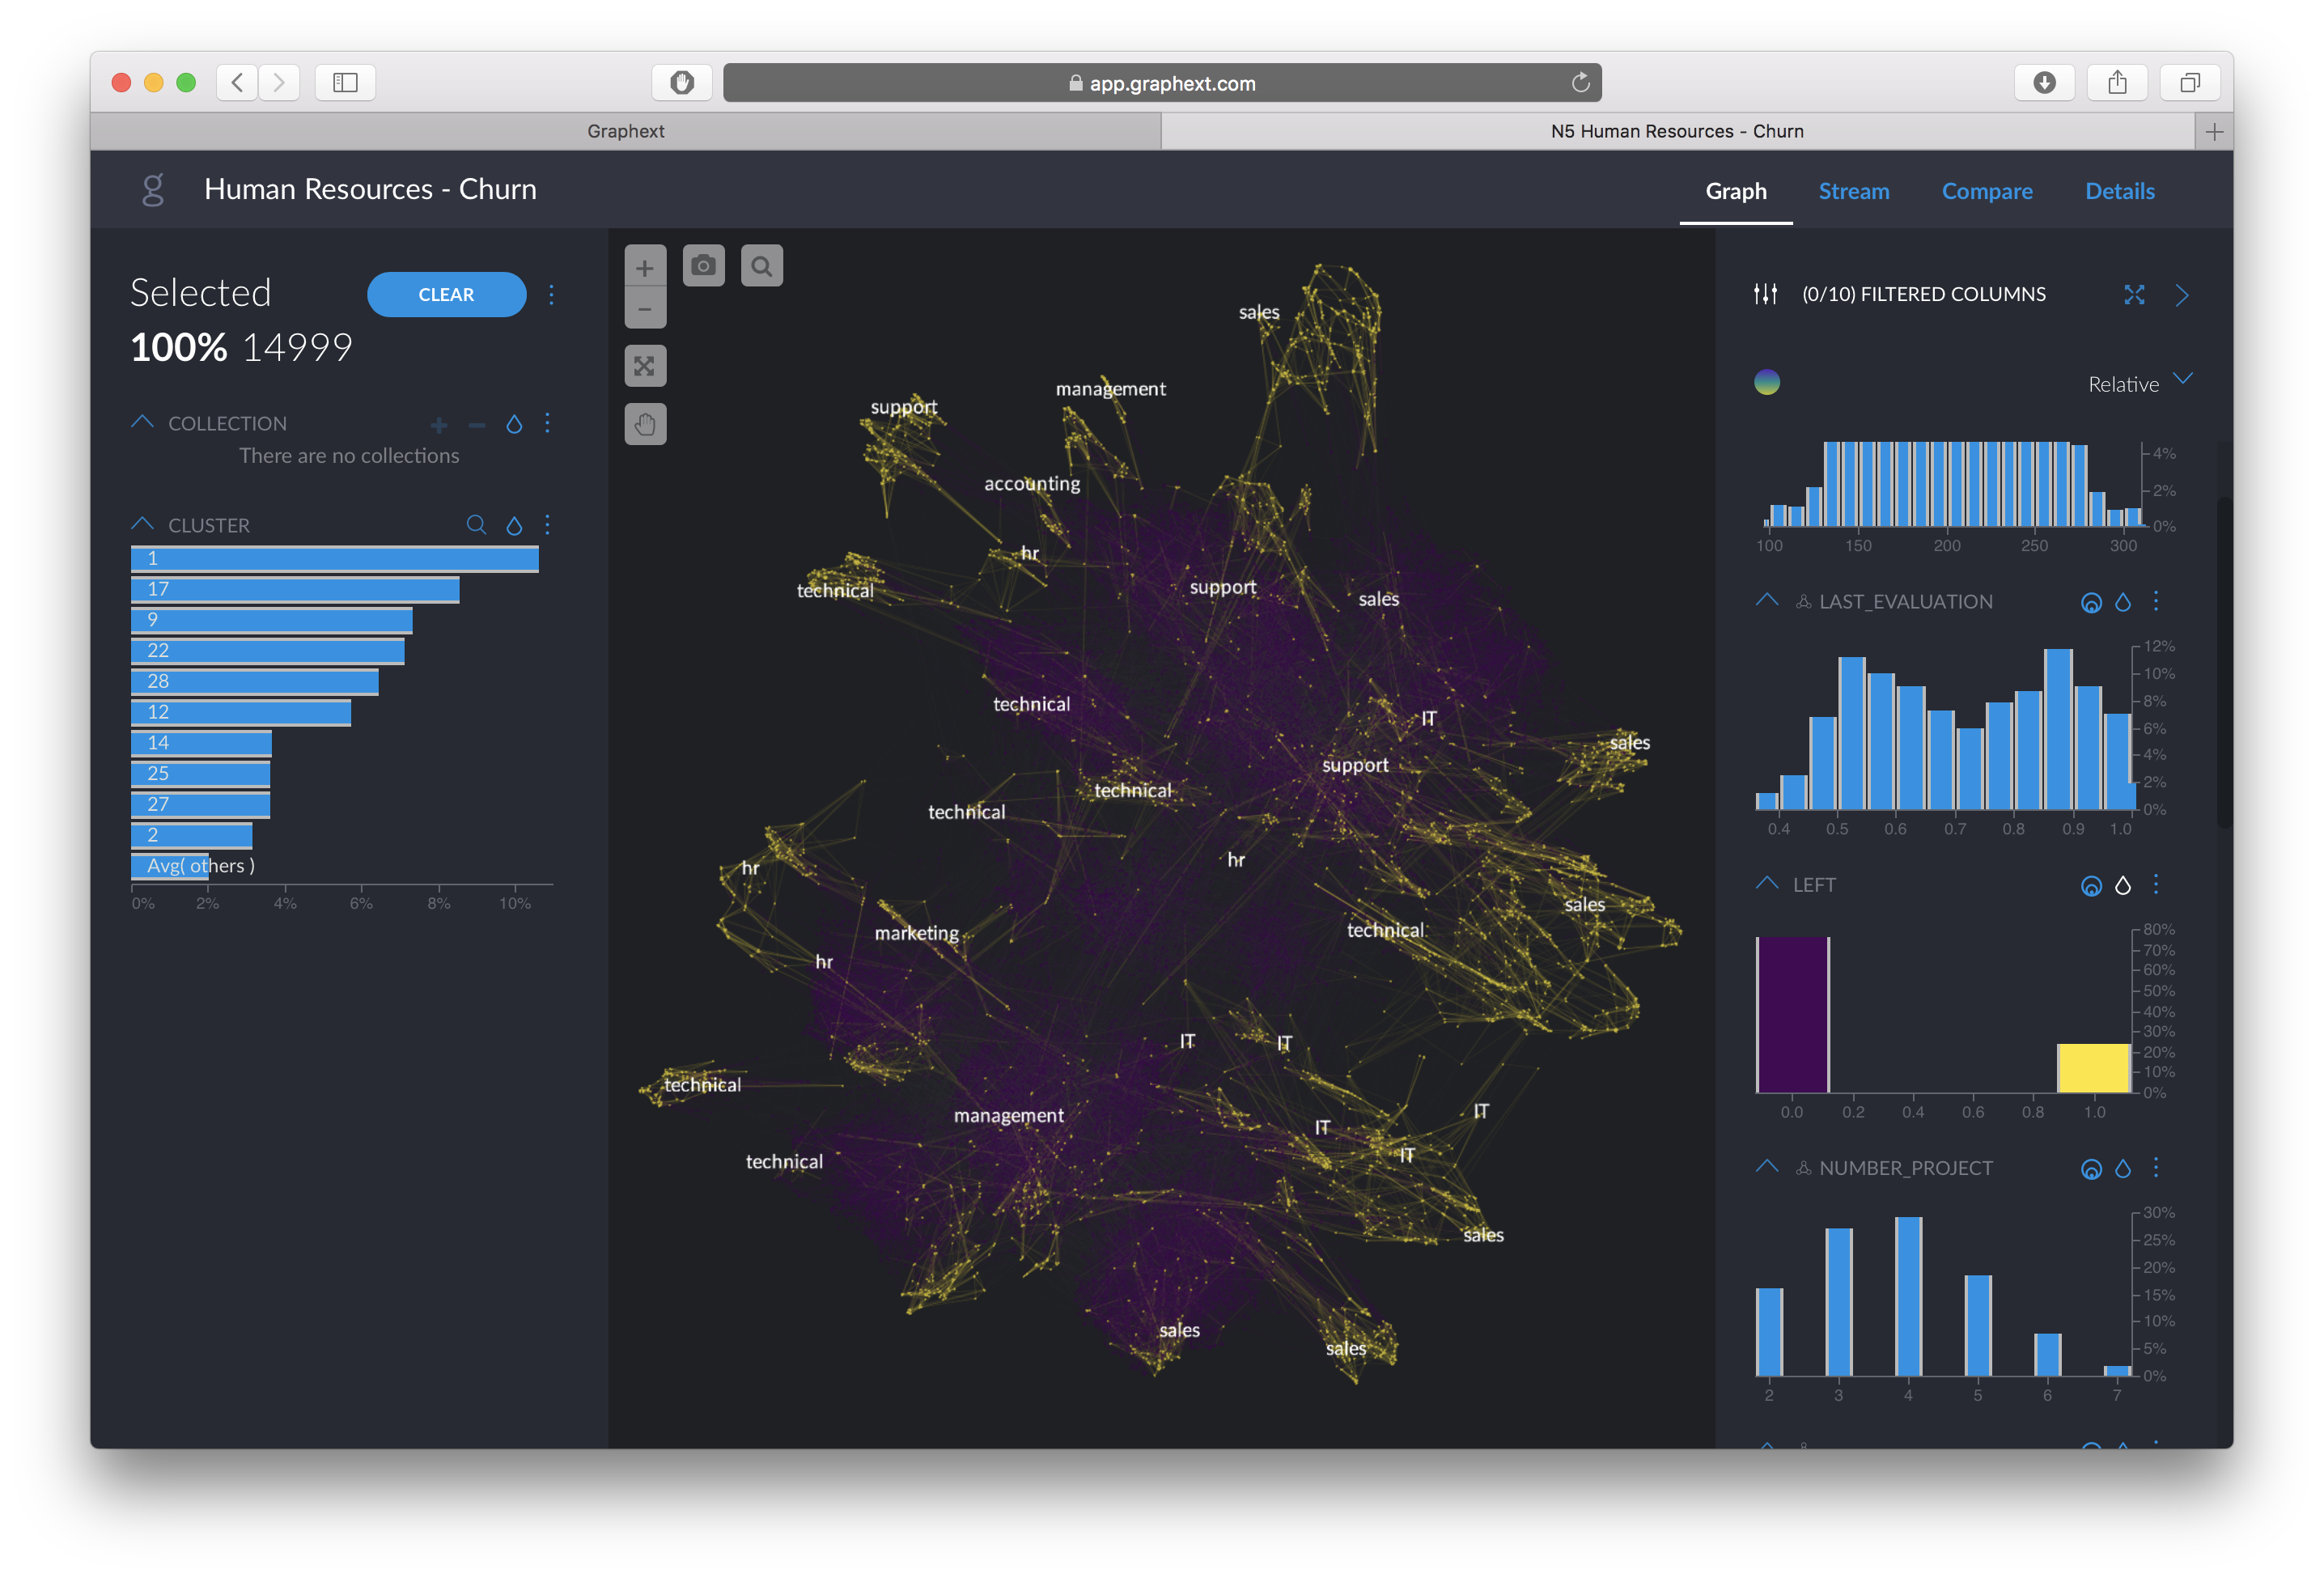
We can clearly see that employees who left, colored in yellow, form different clusters, signifying they have different behaviour patterns even though they are all labeled in the same “LEFT” category.
A traditional analysis using a prediction model would start by putting all “LEFT” employees in the same basket, ignoring the fact that there are many different types of “LEFT”employees. However, using smart data discovery we can recognize the behaviour patterns of these employees, differentiate their behaviours, and ask better questions before we start the prediction.
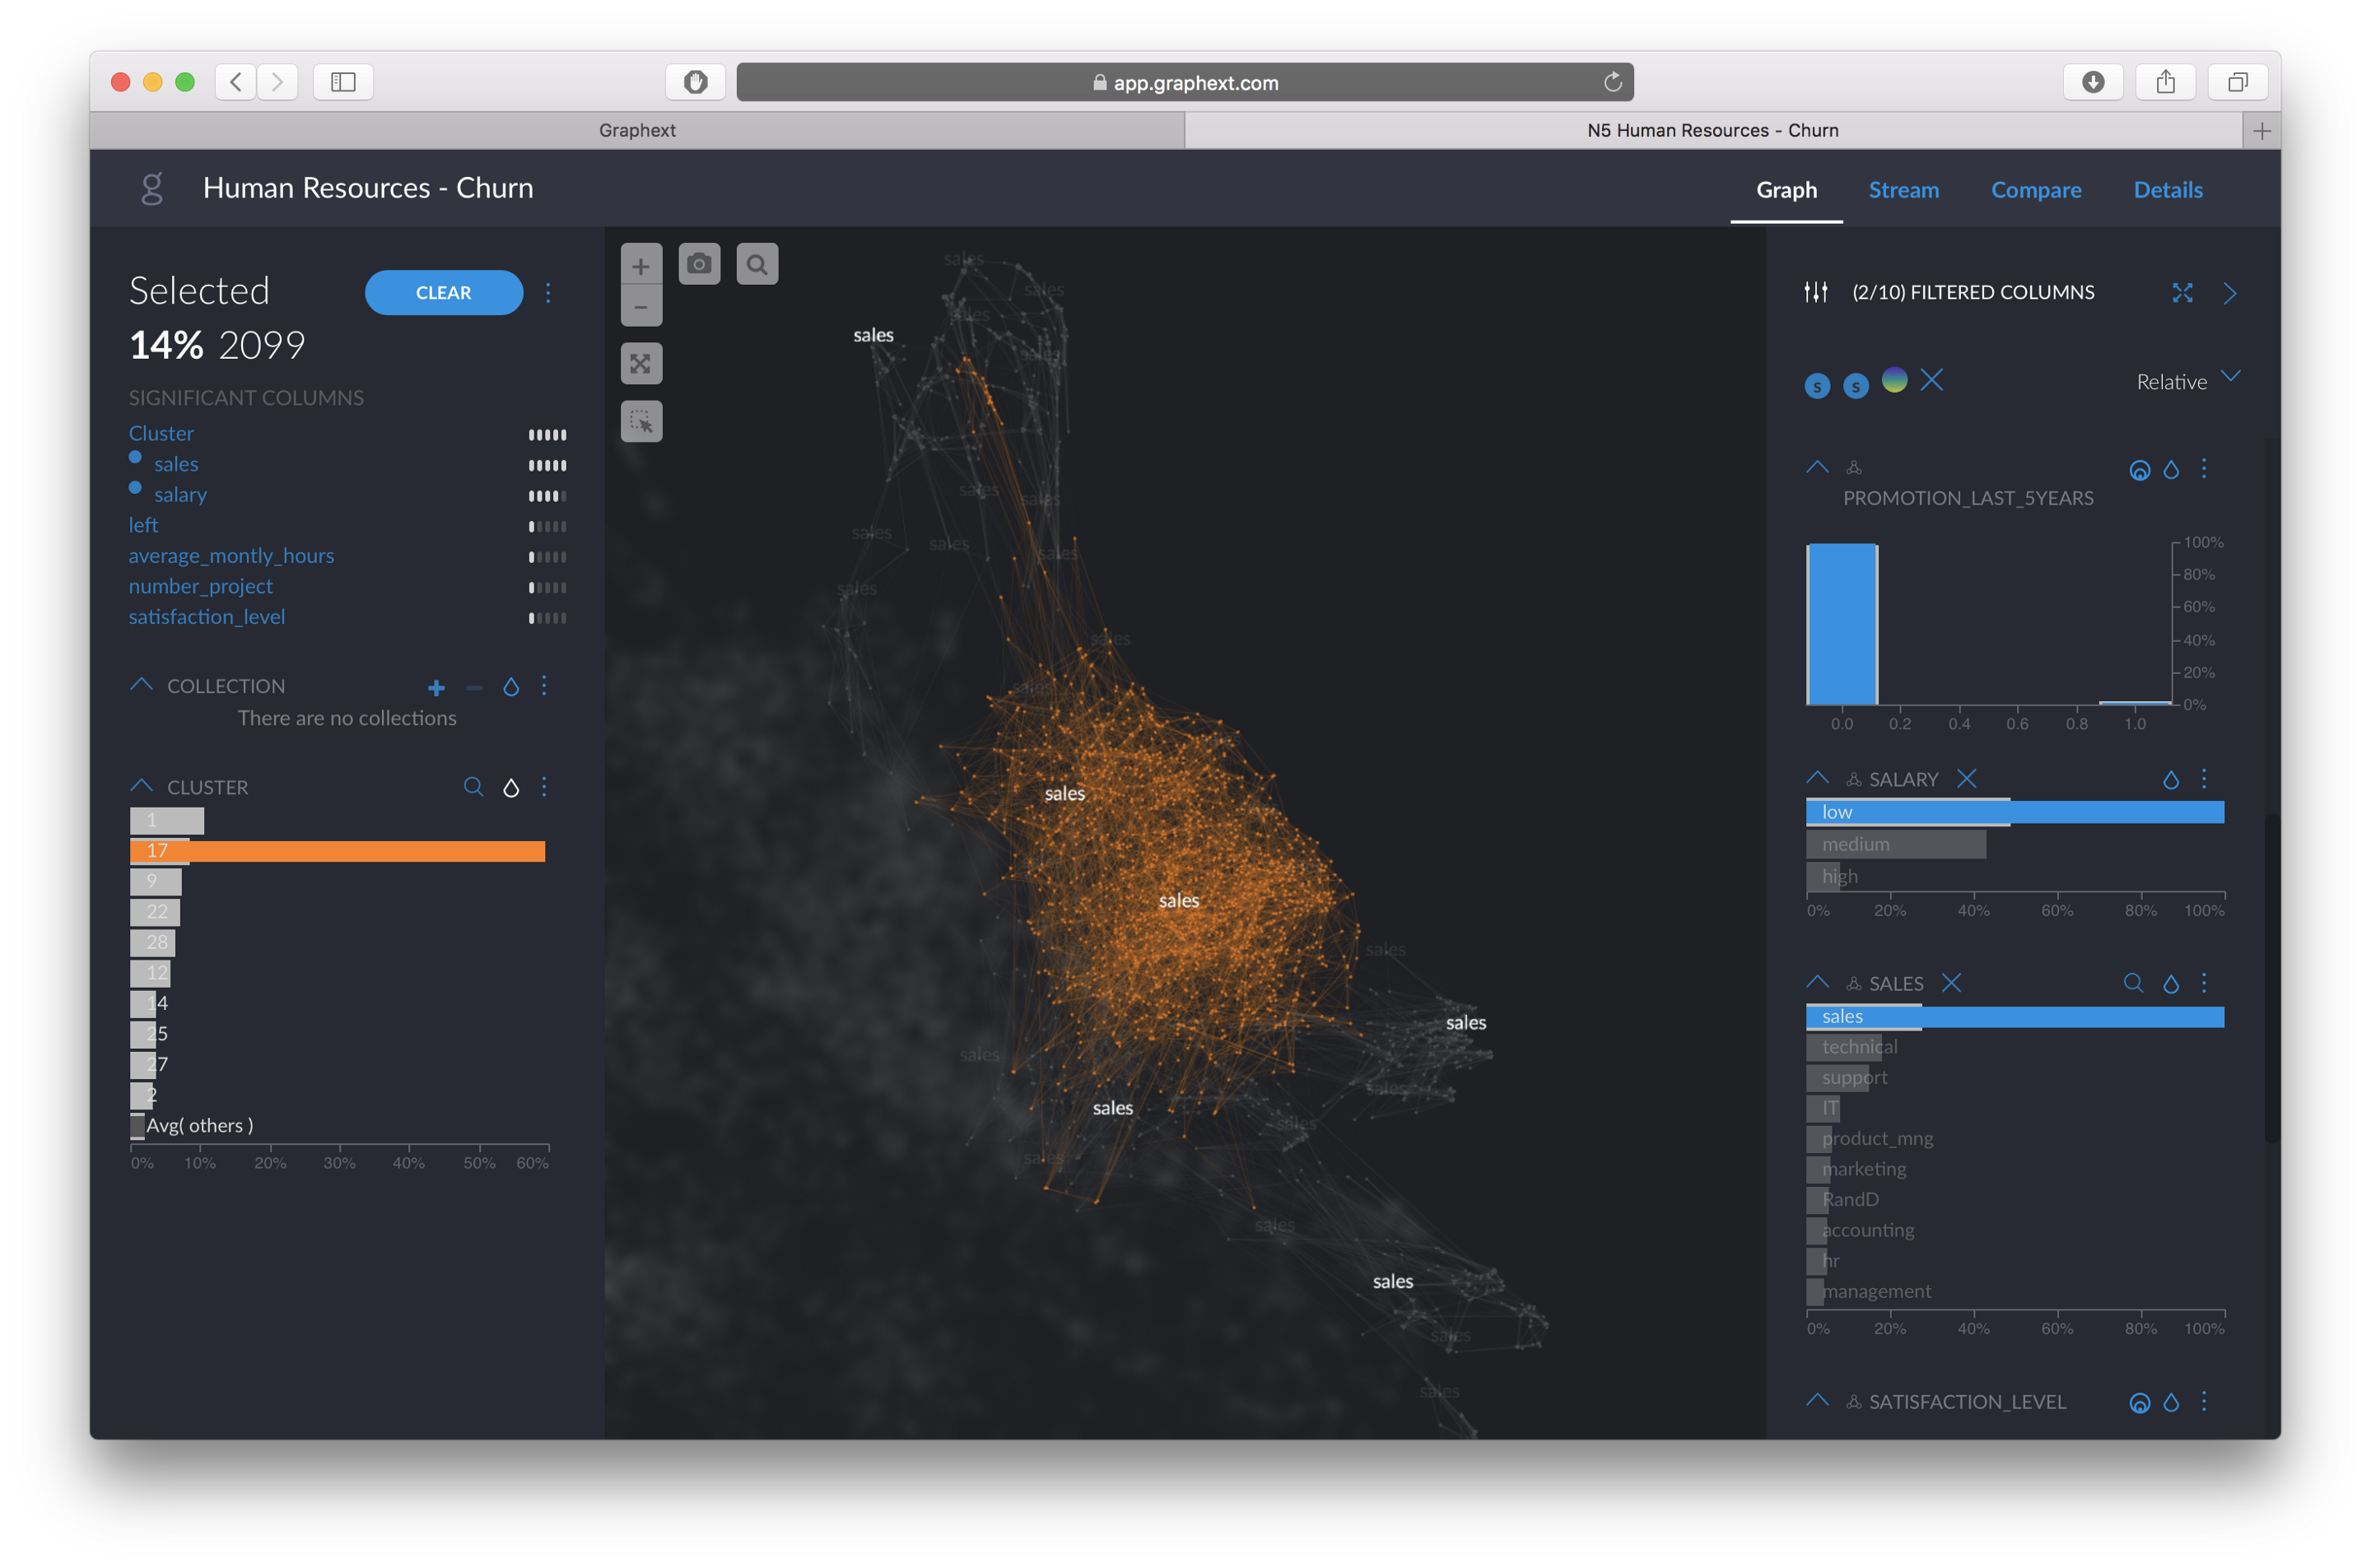
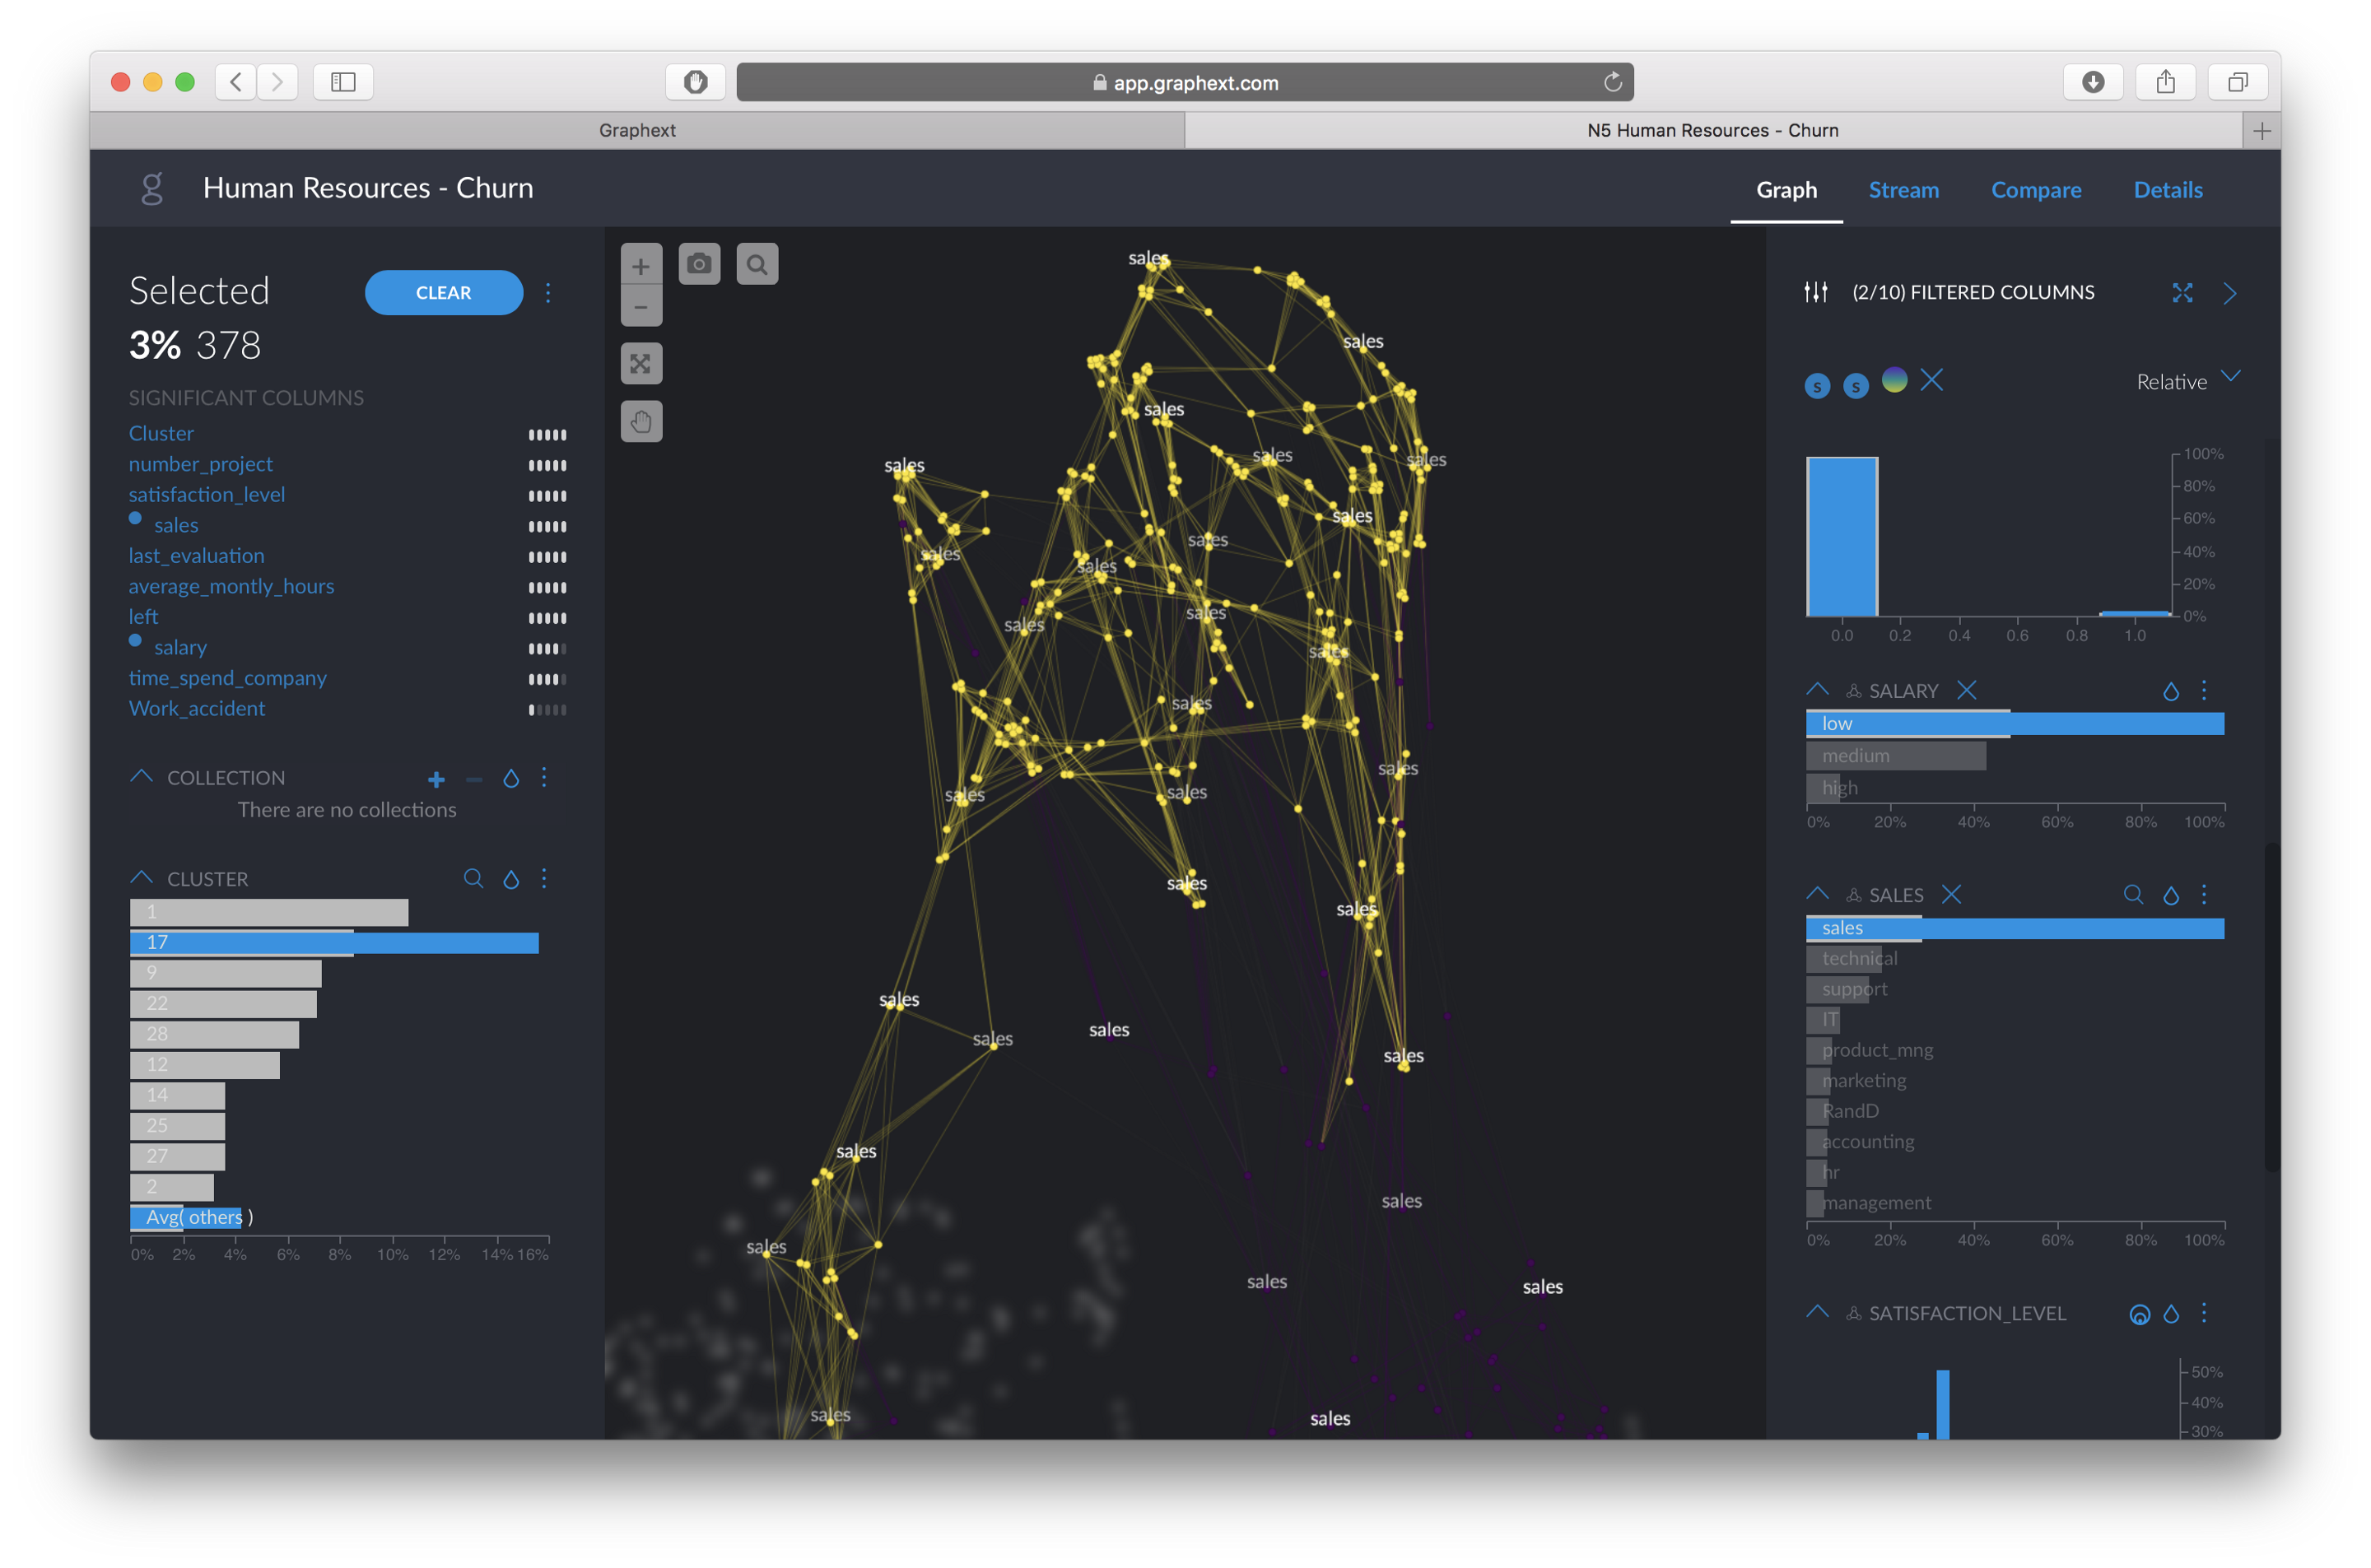
Let’s approach this from a HR perspective, and focus the analysis on the“Sales” department and employees with “low” salaries. By clicking on those two filters, we can narrow down our data selection.
Now, let’s color the employees by “LEFT” or not to see how behaviour patterns differ in this sub-group.
We can see that there are, at least, three different clusters of employees who “LEFT” the company. First, we select the cluster on the top left to find out why they left. The left hand panel will automatically tell us what variables separate more this group from the rest of the population.
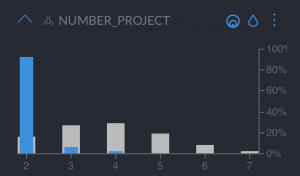
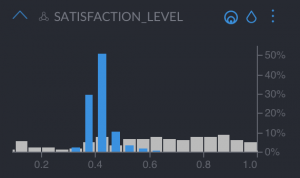
Graphext automatically tells us that they are defined by the distributions of:
- “Number of Projects”, which we can see is very few
- “Satisfaction Level”, which is around 4 out of 10, also very low compared to the whole population
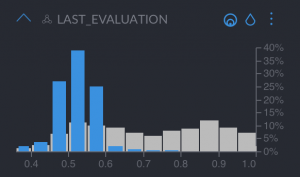
- “Last evaluation”, between 4–6 out of 10, also very low
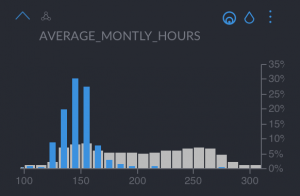
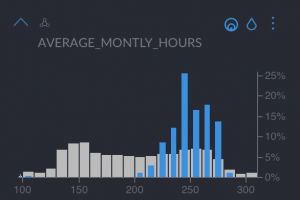
- “Average monthly hours”, lower than average
Now let’s ask the question, would you proactively retain this type of employees in your company? These are employees who are unhappy, worked in few projects and had a bad last evaluation. If you want to retain them, you could provide specific training programs tailored to their needs.
Let’s move on and select the next cluster of employees that have left.
In this case, they are defined by the distributions of:
- “Average monthly hours”, which we can see is very high, but not the highest
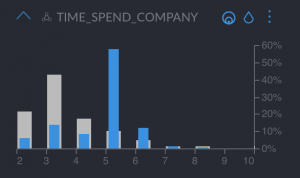
- “Time spent at the company”, peaking in around 5 to 6 years
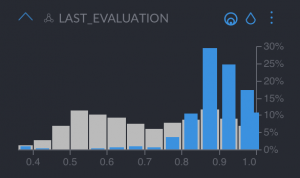
- “Last evaluation”, which we can see is very high, meaning they are very good employees
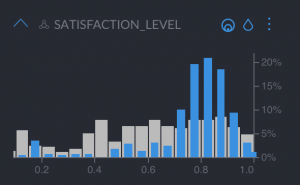
- “Satisfaction level”, which is quite high in the distribution, meaning they are happy
These are great employees that worked many hours, and are happy with the company. They are the people you really want to retain! These employees left probably because they are recruited by another company that offers them a higher salary. To retain them, a retribution program could work wonders.
We have seen two very different behaviour patterns that require different retention strategies. Analysing this data with a traditional prediction model would make you lose the opportunity to make decisions with real impact. Finding these patterns through smart data discovery will allow you to create better prescriptive strategies for each specific behaviour.