
Finding Real Estate Opportunities in Madrid
Using data from more than 20k real estate adverts, our team sought to analyze the property sector in Madrid. The goal was to use Graphext's predictive power to discover hidden opportunities for buying or investing. To do this we studied the distribution of value, look at which features of a property are most influential when considering the property's value.
We can appreciate how the prices in Madrid, as in almost every city, tend to increase while you are getting closer to the city center. However, there is also a trend suggesting an increase in property value moving away from the center and towards the northwest towards areas like Pozuelo, Aravaca, Las Rozas, Montecarmelo and Las Tablas.
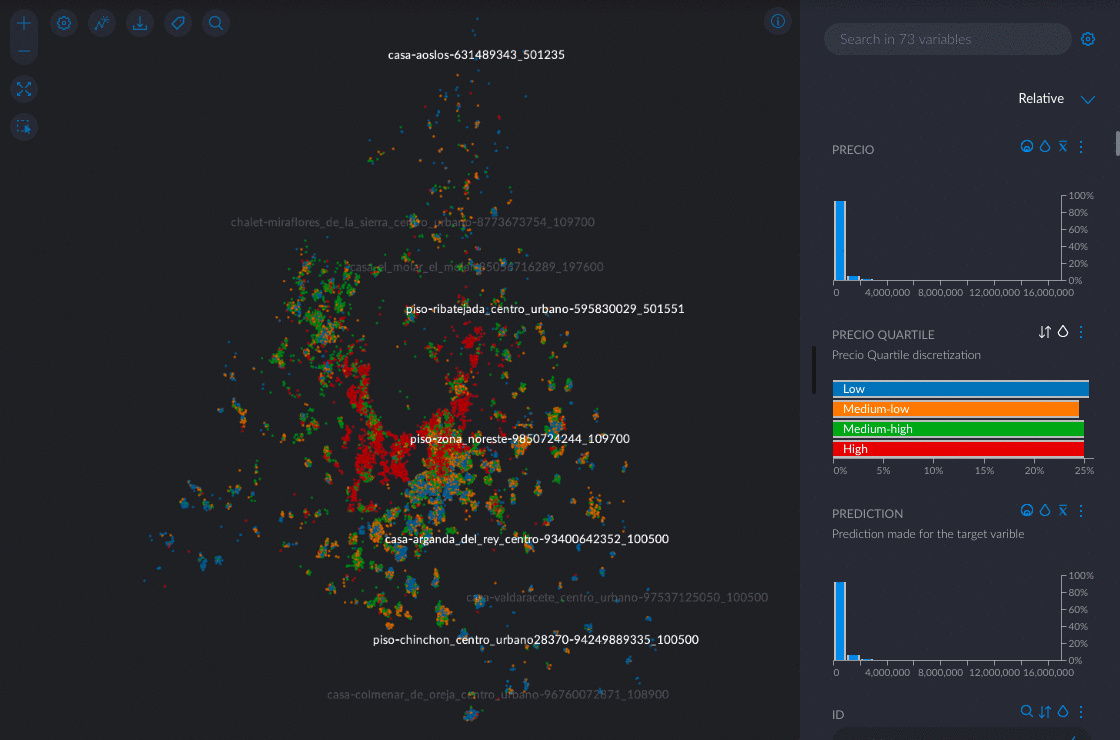
Almost the opposite happens in the other direction. If you go further southeast, the prices go down. Arganzuela, Carabanchel, Getafe, Leganés, Fuenlabrada... 'El cinturón sur'.
Our team first set out to discover the most important factors when considering the price of property in a specific area. What makes an area an expensive place to live?
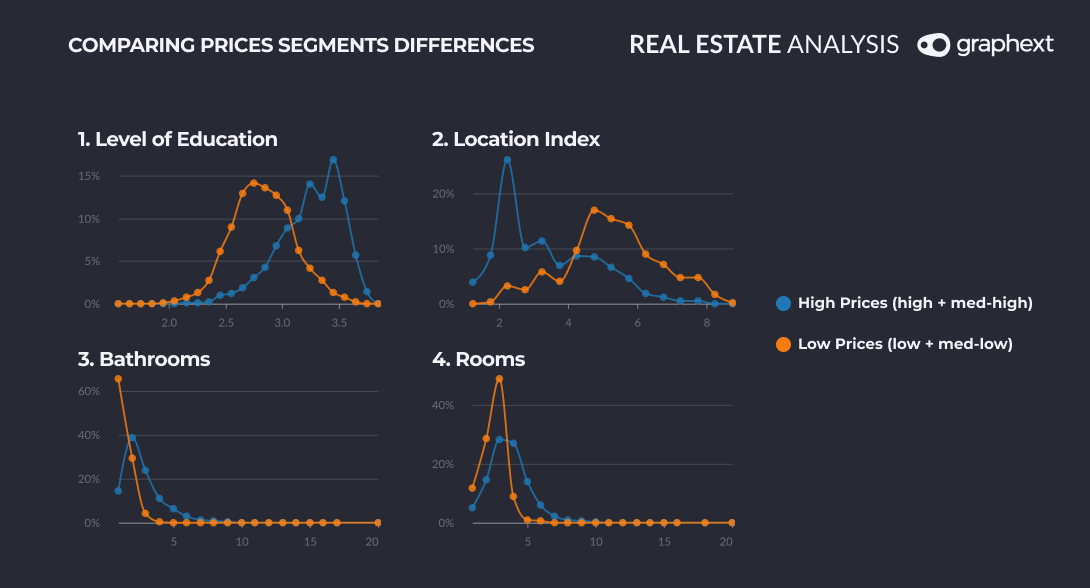
The main difference is found in habitants' education level. It is the most important variable when differentiating both segments. This insight made us wonder; Is it easier to study in an expensive area or do people with higher levels of education simply tend to live there? Maybe both? A virtuous loop?
The second most important factor is Location Index, a number between 1 and 9 summarizing the overall quality of the location, lower values being better. It seems reasonable that areas with more expensive houses have a better rate.
Something not that obvious happens with the 3rd and 4th variables. Apparently the amount of bathrooms has a bigger correlation with price difference than the number of rooms. Houses with lower prices tend to have 2 or less bathrooms while more expensive ones range from 2 to 4.
Cheaper houses tend to have 2 or 3 bedrooms compared to the 3 or 4 bedrooms we usually see in more expensive houses.
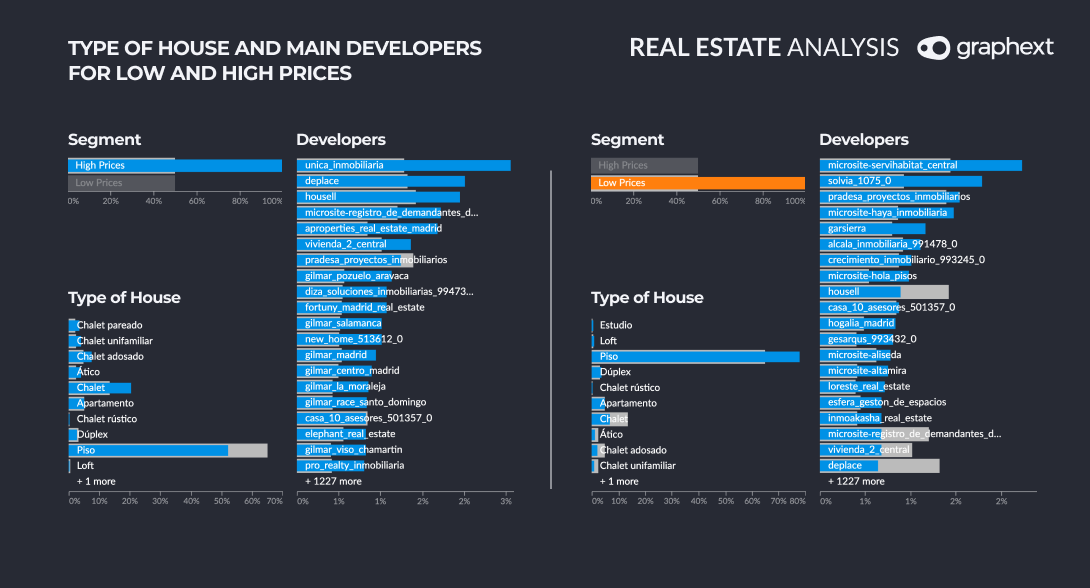
Although it could seem obvious, we can confirm that in the Low Price segment we see mainly flats and apartments. Duplexes are also included here, something not so evident.
For the High Price segment we find chalets of any kind as the main type, followed by attics.
Developer specialization is key to success.
In terms of developers, it is notable that none from the top 10 of any segment is included in the top 10 of the other. Only Housell and Pradesa are included in both segments. This insight shows us that specialization is really important to succeed in this sector.
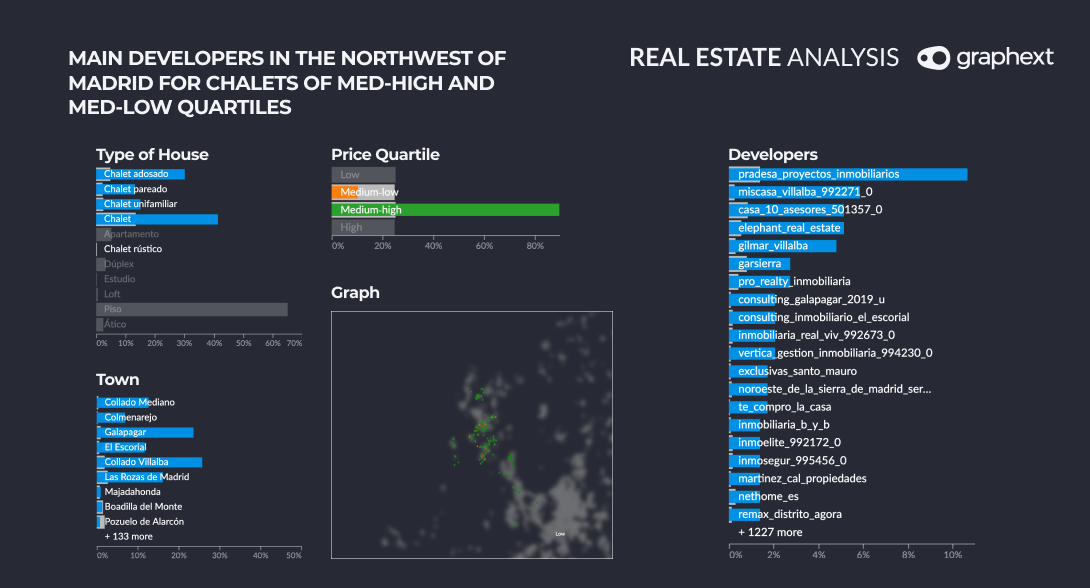
If specialization is necessary for success, analyzing niches is critical for good positioning. For example, if we wanted to position ourselves in chalets of medium-low and medium-high prices in the northwest of Madrid, we should take into account that Pradesa is the main player by far.
We enriched our data with Census information. This allowed us to involve socio-demographic factors in our analysis.
Thanks to Census data enrichment, we are able to make a more complex analysis than simply exploring a Real Estate platform's data. We introduce square meters per house, number of persons per house, education level, proportion of foreigners, proportion of married couples, age and location index.
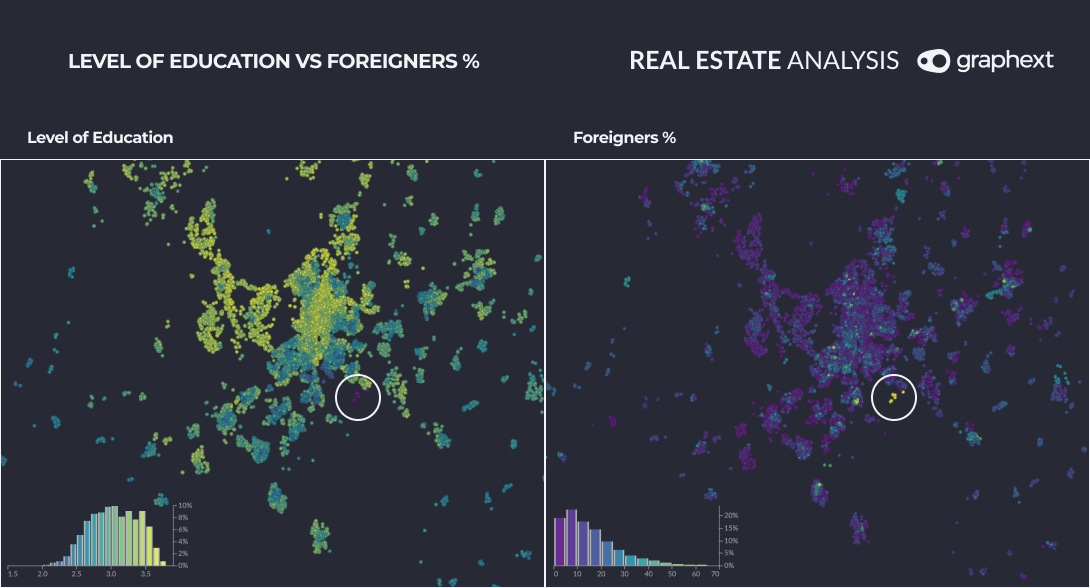
Coloring our Graph by each of these variables to understand its distribution, we found that this zone inside Ensanche de Vallecas has the lowest education level of all Madrid. We can also see how immigration levels match almost exactly with low education levels. We could say that there is a clear problem of social integration in the area.
Finding Opportunities
With Graphext's prediction flow we can calculate the 'real' price of each house based on its characteristics. Once we have it, we can compare their announcement price with their 'real' price. Then, all of those houses with a lower price in the announcement than the price we have calculated are undervalued, so they are potential opportunities.
To start identifying these opportunities, we have to focus on Error Category. Overpredicted houses are possible opportunities since Graphext thinks they are worth more than their announced price. However, there's a problem that we need to take into account. Not every overprediction is an opportunity. There are false, outdated or flawed adds and, obviously, Graphext will commit errors too.
For this reason, we will need to filter this Overprediction category with the error that we recognize as suitable. 20/30k error for a 150/200k house? 100/200k for 1/1.5 million? Well, that's something to discuss with your partner, your pillow or your Real State's expert brother-in-law.
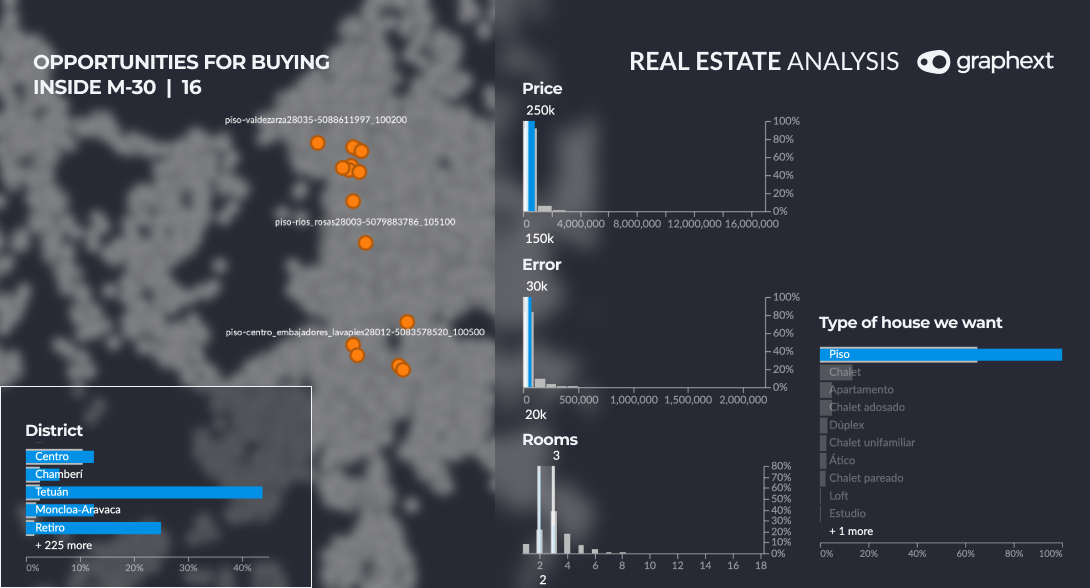
Nevertheless, every opportunity should be checked to confirm it is a real opportunity and not a false alarm.