
Healthy Food: A Tweet Content Analysis
Last week over a beer in a bar close by, yet another friend of mine proudly announced that she started a vegan diet because she found it healthier and wants to take better care of her body. As usual, it turned out to be a night full of discussions about different interpretations of healthy lifestyles. The topic in general causes a lot of excitement, also or especially on social media. Without any prejudices I wanted to analyze the main topics around Healthy Food and Snacks on Twitter.
I didn’t want to specify a particular time horizon but obtain a large enough number of 30k Tweets. My idea was to just gain a quick snapshot of the current situation and stories of Tweets that mention either Healthy Food or Healthy Snacks. Using Graphext’s scraping tool Tractor I set these parameters accordingly. After my CSV file was ready, I passed it to Graphext and let it do all the work for me. Keyword-Extraction, Sentiment Analysis, Automated Clustering, .. the list could go far longer than that. I found it very handy that my dataset wa. automatically enriched with additional information without any need of specifying the relevant columns for that step. The interactive network that I received after the project creation was finished, had the following shape.
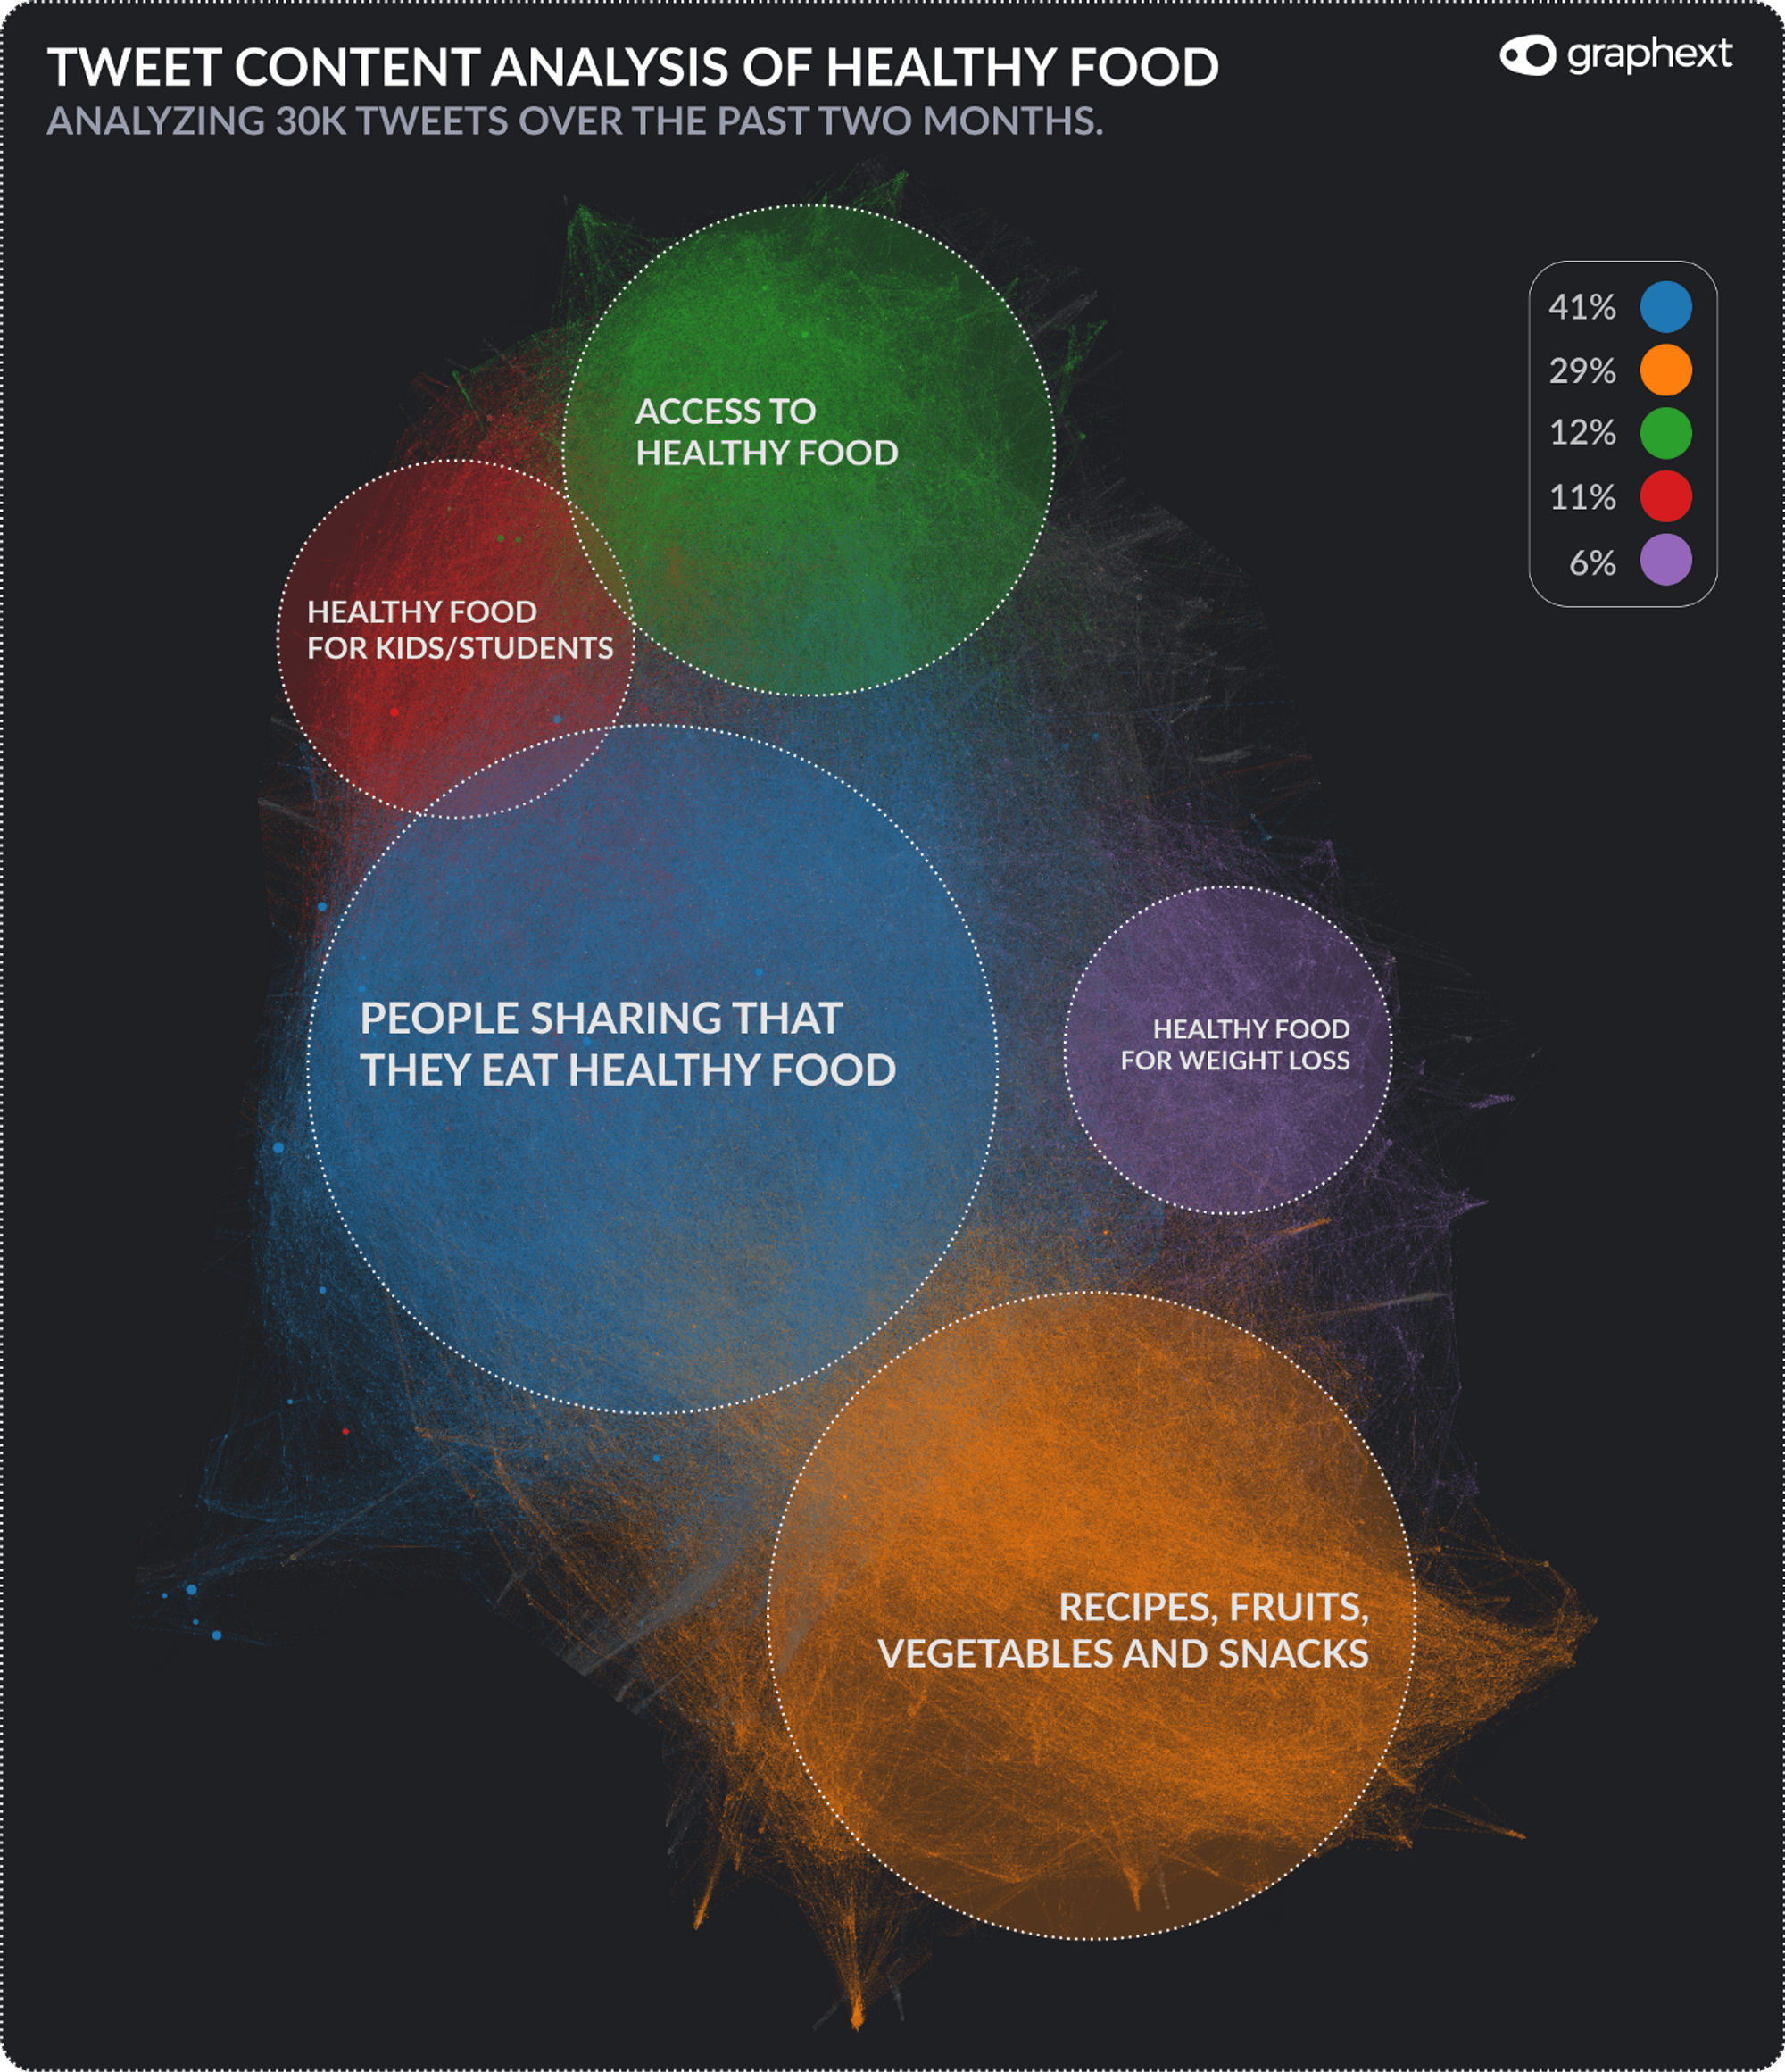
Every node represents a Tweet and every Tweet is defined by its keywords and its neighbours that share similar content. Neighbours are connected to each other and many connections form distinctive clusters of stories as you can see in the image above. Interestingly, the majority of the Tweets are not mentioning Healthy Food as a matter of a diet. The biggest cluster holds Tweets about people updating their followers that they now start eating healthy, that they don’t like healthy food or they compare it to junk food (blue cluster). Mostly, they don’t go into more detail of their definition of healthy such as the 2nd biggest cluster, the orange one.
Together with the purple cluster, we can find more stories about particular diets and ingredients that people consider healthy. By filtering our network for certain keywords and saving these subsets into collections, we can obtain the number of their appearances in the Tweets and compare them with each other. For example, we see that Organic Food is coming right after Veganism in popularity and that more people talk about Fruits than Vegetables.
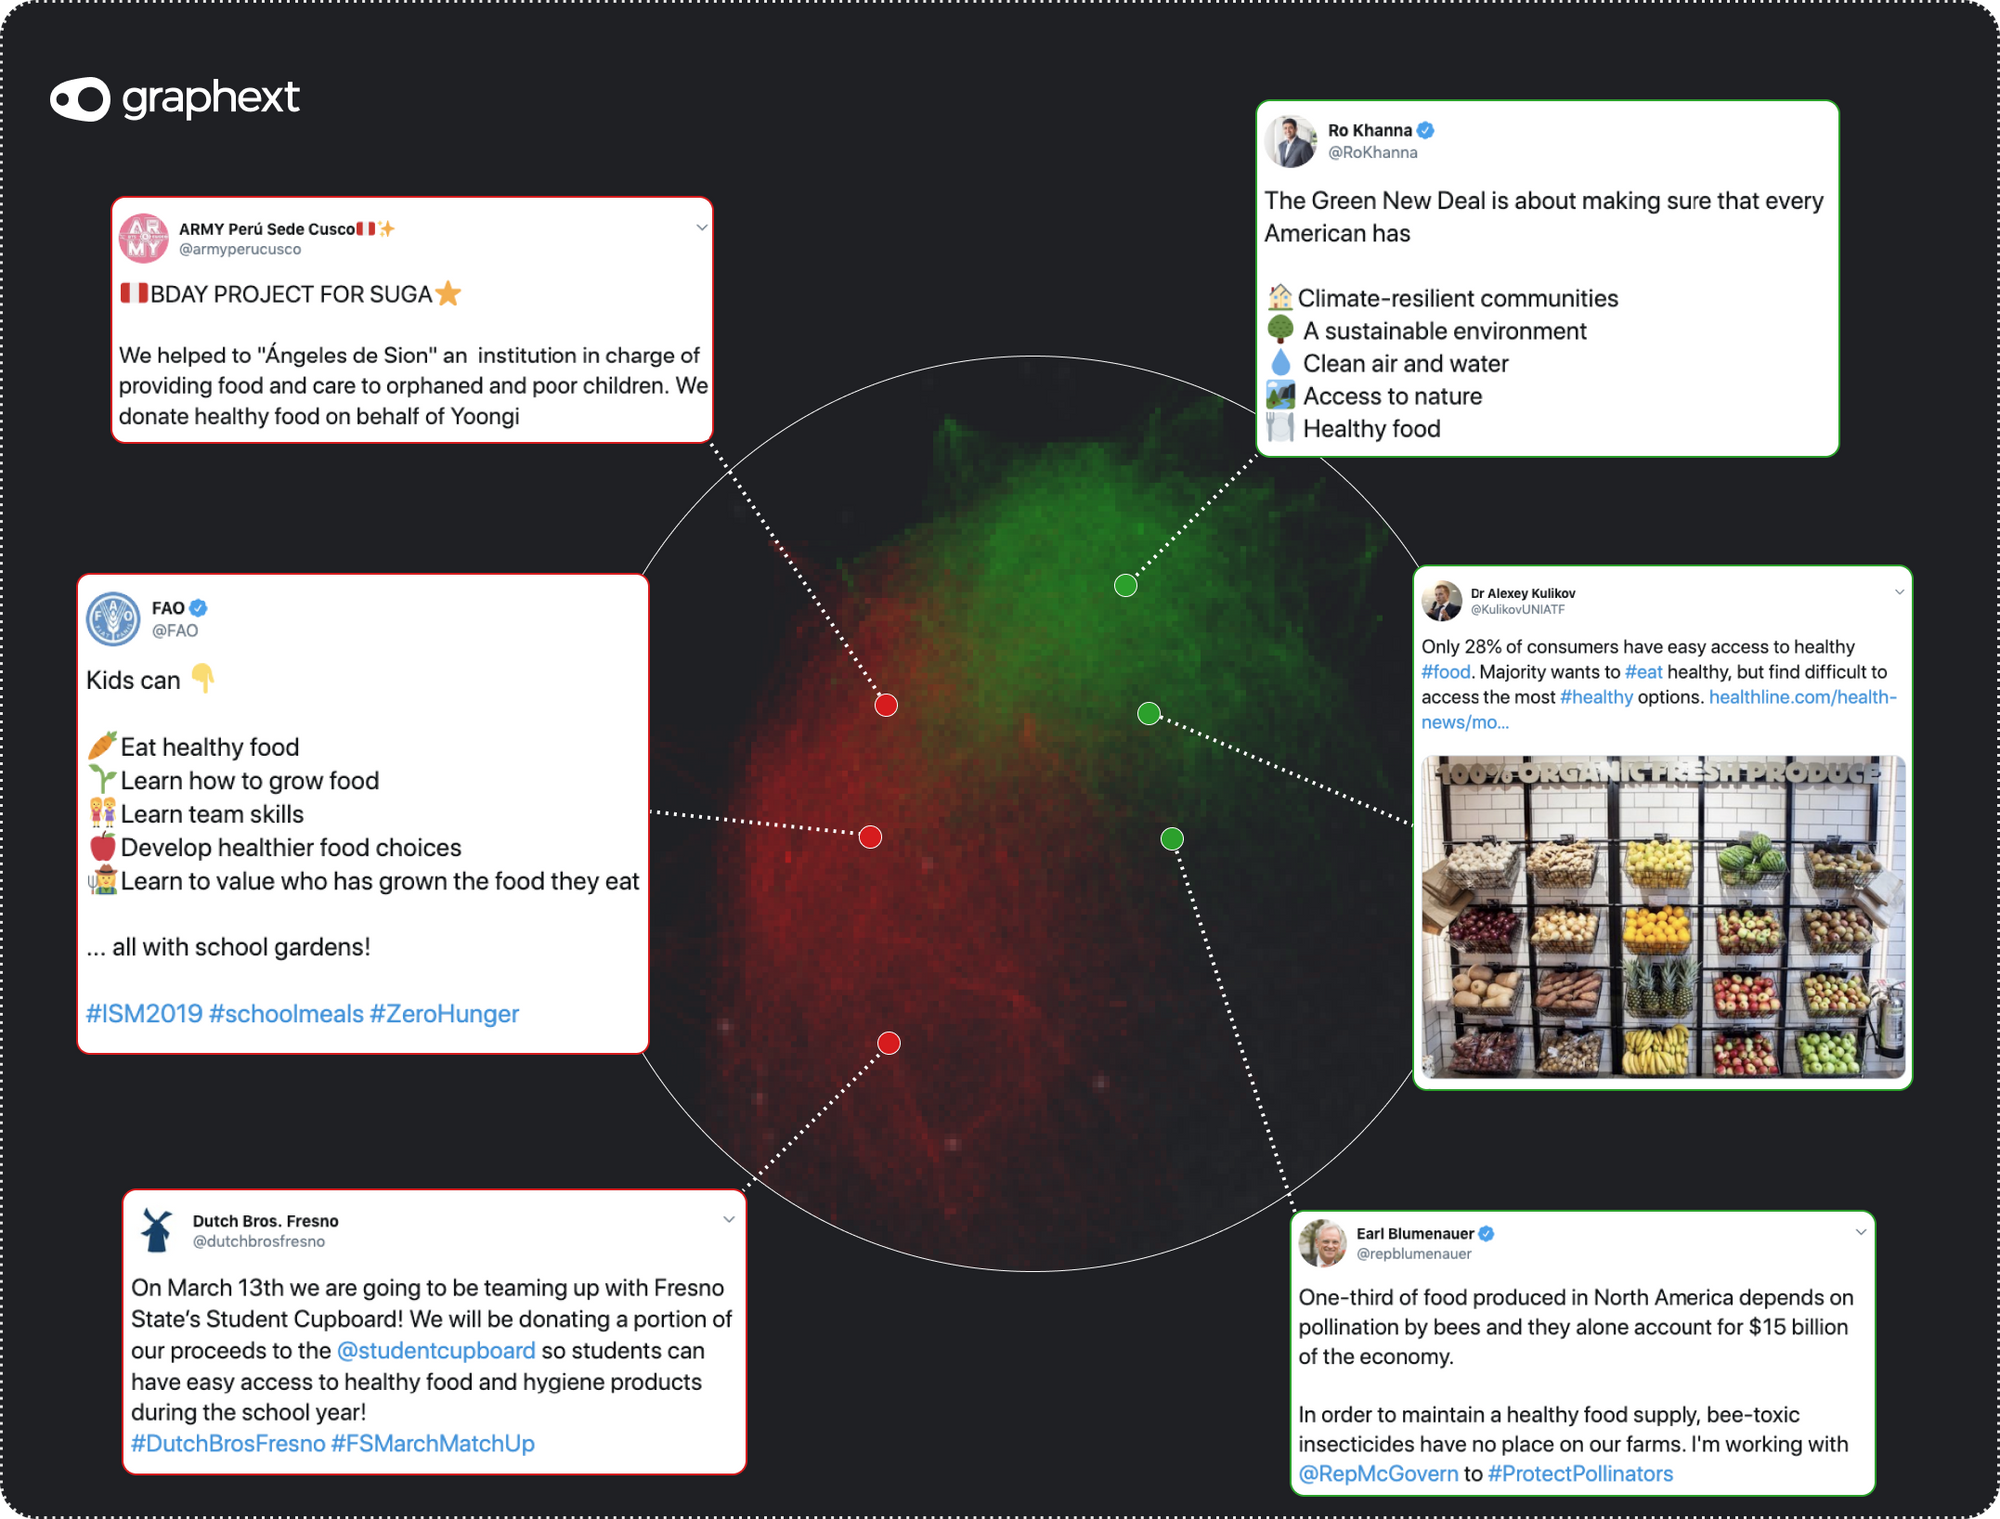
The biggest surprise for me are the green and the red cluster. The green cluster is about Tweets that want to increase awareness about the importance of having access to Healthy Food. Most of us might take it for granted to freely choose in the supermarket among all the options but this isn’t the case for everybody. Therefore, politicians or NGOs try to reach out to their audiences to promote new policies or programs that are supposed to increase the access to Healthy Food options for the people. The red cluster links Healthy Food to Kids and Students. For example, promoting Healthy Food donations to local colleges or announcing a school farming project to educate kids from an early age on about Healthy Food.
As you can see, these Text/Tweet Content Analysis projects can reveal unexpected but significant insights. To get a general understanding of a market it can be very helpful to start with a project like this and extract your topics of interest for further analysis. For example, now that I know about its importance, I could start scraping a larger amount of Tweets about Diabetic Diets in order to get a deeper understanding of brands, products and topics that are mentioned with it and use it for my marketing campaigns.