
How Aquaservice Use Graphext To Improve Their Prediction Models
Every day a fleet of Aquaservice drivers load trucks with a number of water bottles. Then, following a route, each driver delivers these water bottles to homes and businesses around Spain. But how many bottles get loaded into each truck each day?
Despite sounding like 15 points on a high school maths exam paper, this is a big question for Aquaservice. It concerns prediction models & demand forecasting.
To give some context, one bottle weighs 20.85Kg. By saving an average of 4 bottles per route in a fleet of 100 hundred trucks, Aquaservice would be avoiding carrying 8.340Kg of bottles that are not going to be delivered.
The Challenge
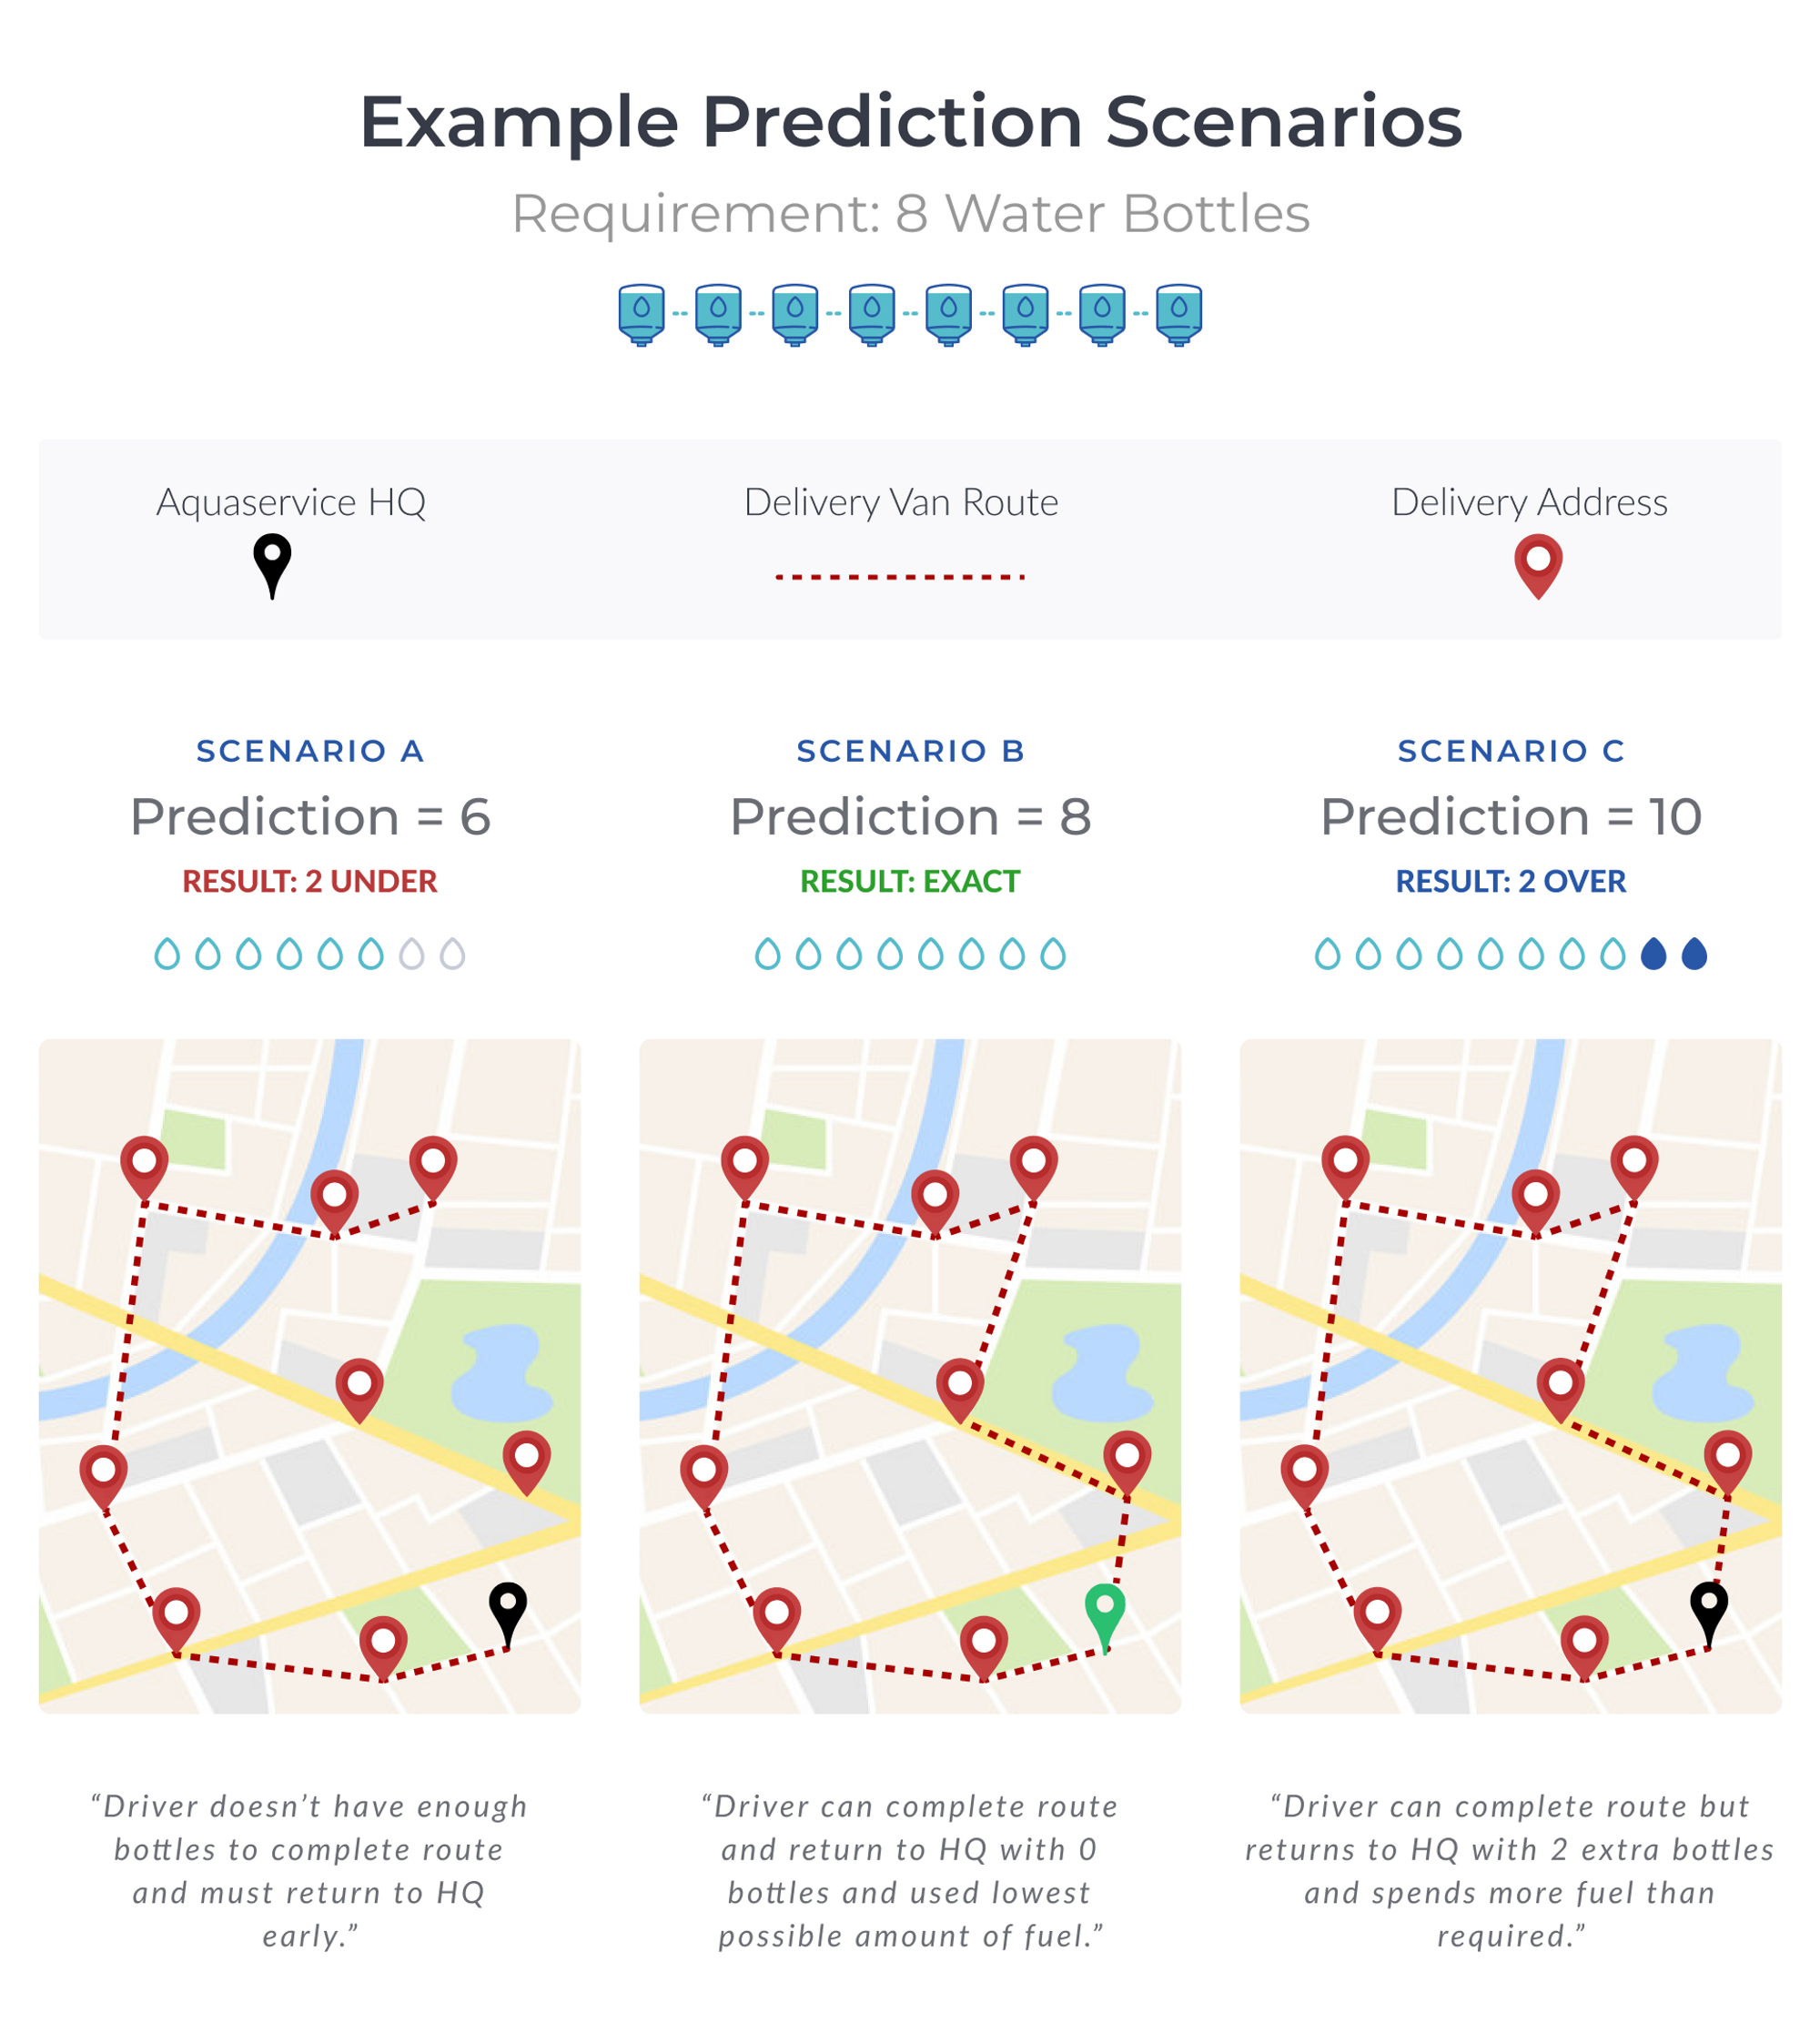
Aquaservice use two prediction models to calculate the number of water bottles to load into each of their delivery trucks every day. The first model predicts the total amount of bottles to be delivered throughout the entire day. The second model predicts the amount that would be delivered in the morning and the amount that would be delivered in the afternoon.
Predicting more consumer demand than necessary means additional fuel is required. Predicting less consumer demand than is required means that drivers have to return to HQ to collect more water and then head back out to complete their route.
When dealing with datasets with many variables, there are lots of ways to tune and refine the parameters of the models. Improving the accuracy of a model becomes become an art and an iterative process of trial and error.
"For the Aquaservice data science team, Graphext makes it simple to identify patterns or similarities in those routes where our model underpredicts."
- David Gurrea, Aquaservice Data ScientistDavid Gurrea, Aquaservice Data Scientist
The Aquaservice data science team turned to Graphext to explore and interrogate their model, hoping to find ways to squeeze more accuracy from it.
The Dataset & Type of Analysis
The dataset that Aquaservice loaded into Graphext contained the predictions made by their model for each delivery route along with the model's error score.
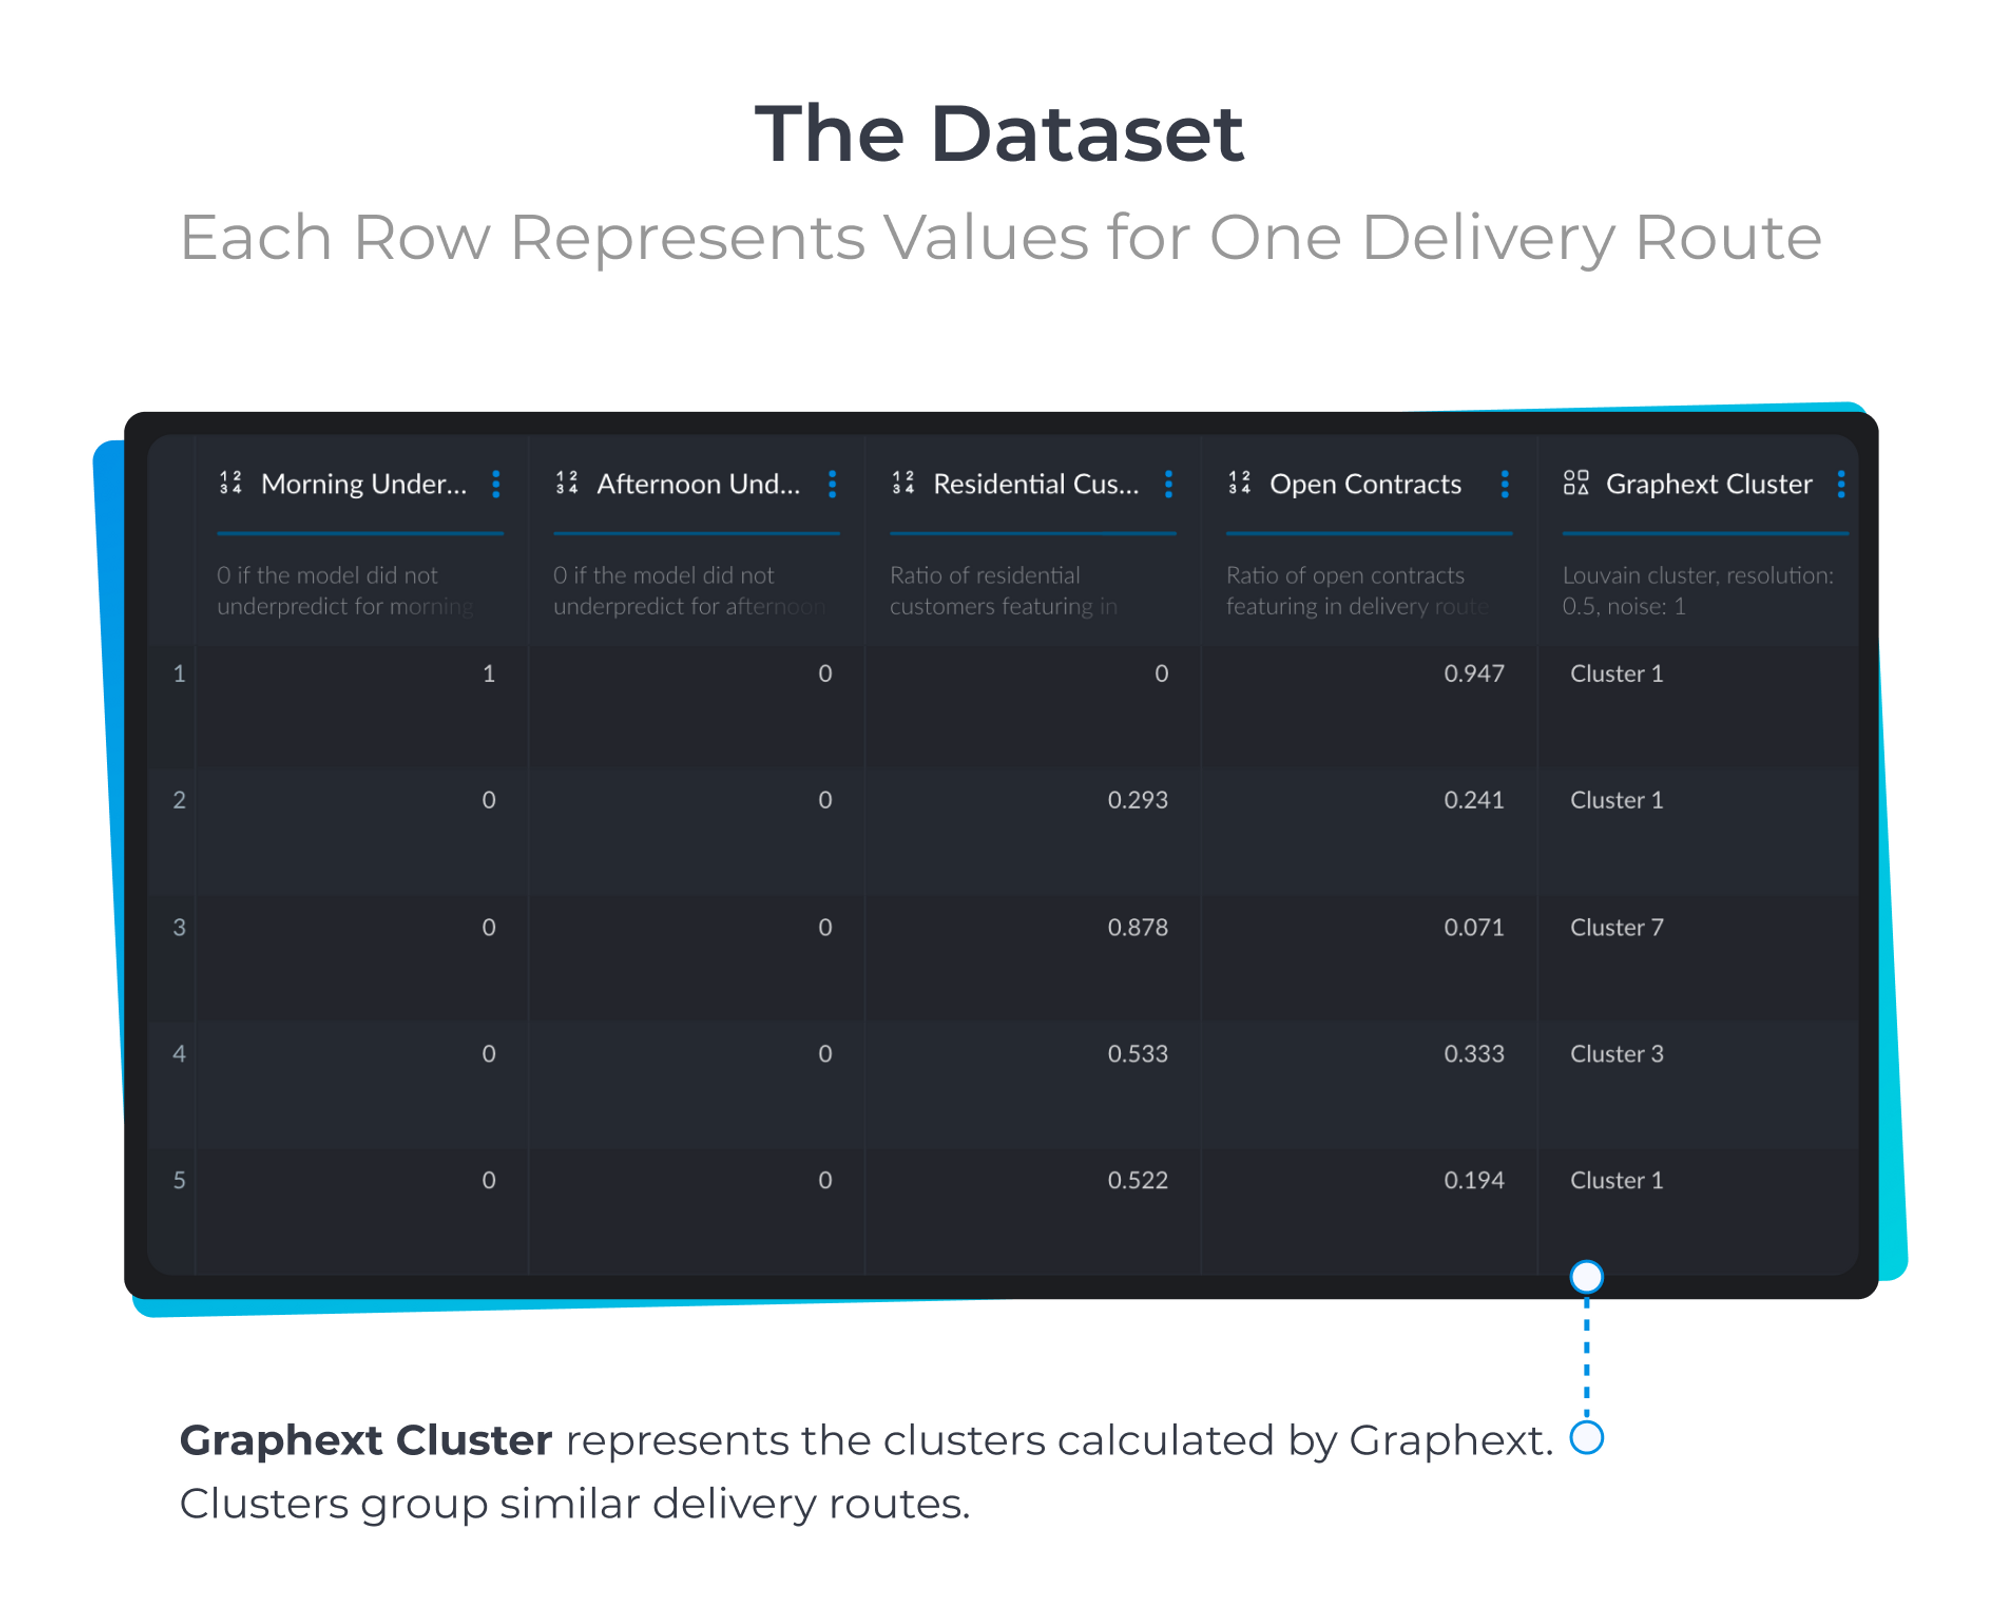
They clustered all routes to find what combination of factors was more prone to higher levels of error in their models. They also took advantage of Graphext's cross filters to quickly explore the relationships between sets of key variables.
The clustering model Aquaservice built looked to expose the features of delivery routes that were subject to a higher error score.
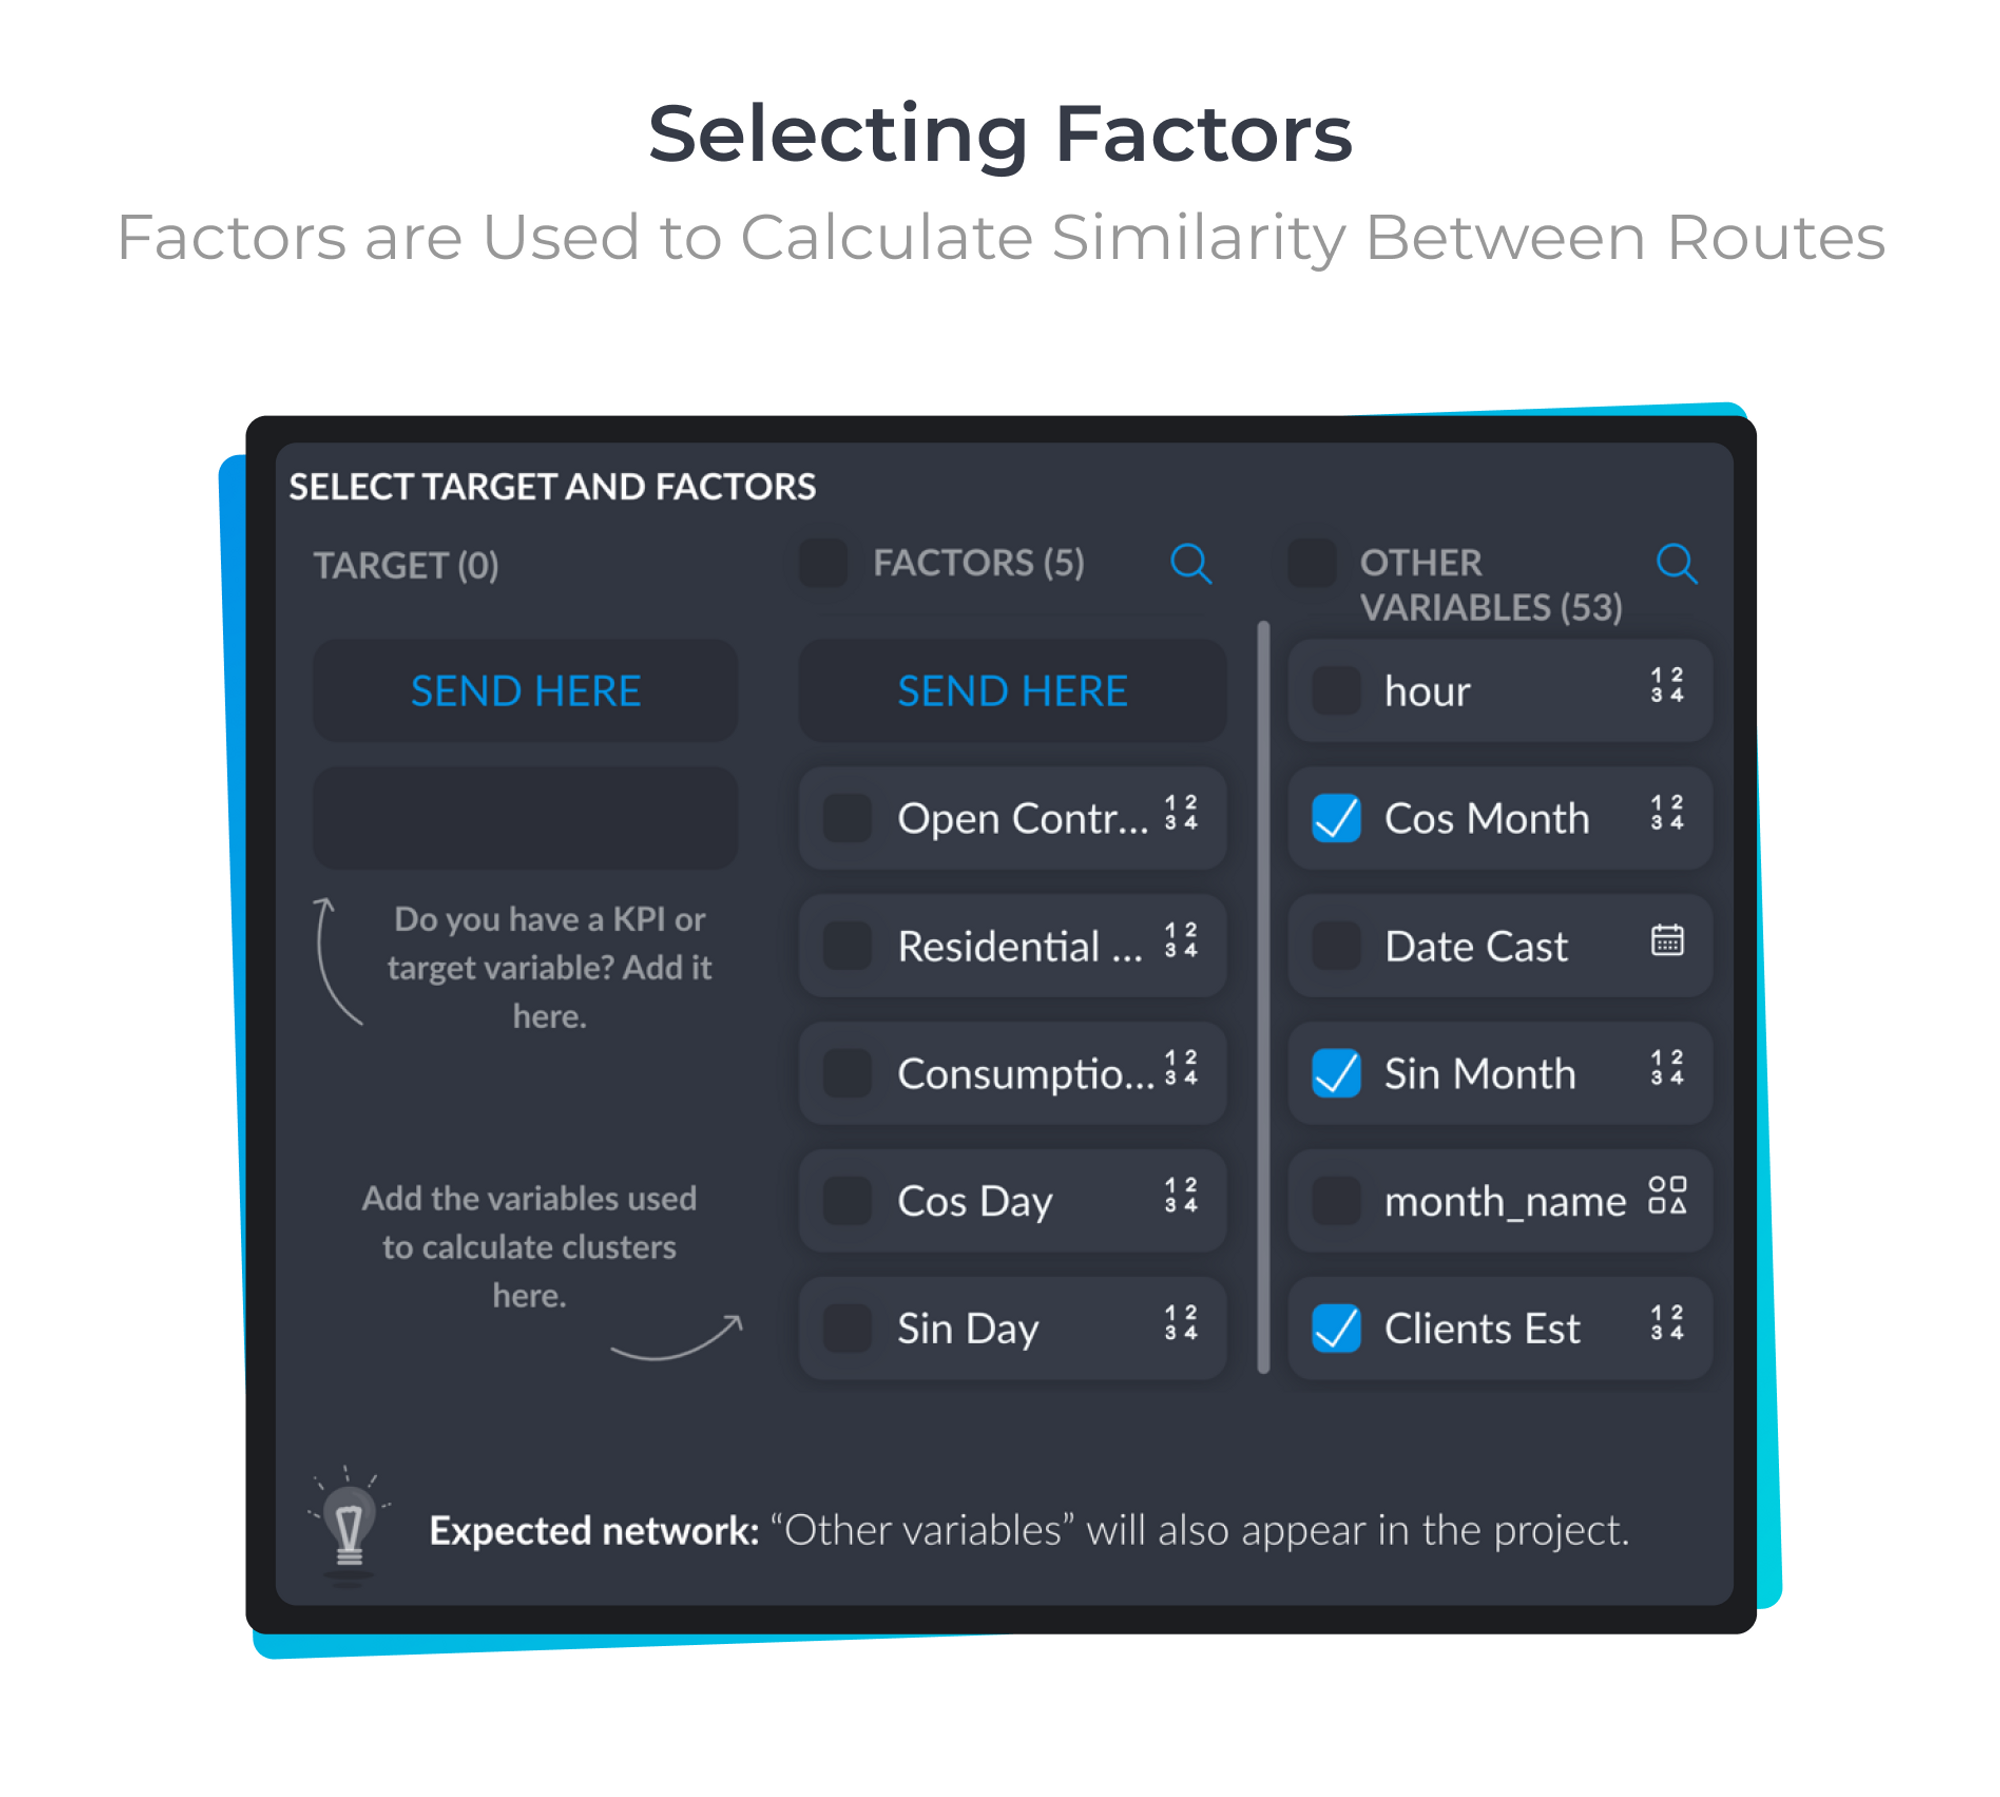
Selecting Factors to Calculate Similarity Between Delivery Routes
To spot patterns amongst the errors made by their prediction model, the Aquaservice data science team used over 30 variables to cluster their dataset. These contained specific information about the Customer Type, Contract Type, Day of the Week and Model Forecasts.
Exposing Hidden Factors That Influence Prediction Error
With their clustering model built, Graphext generated a network visualisation grouping similar delivery routes.
The Aquaservice team could turn their attention to inspecting the performance of their two prediction models, paying specific attention to two variables; Morning Underprediction and Afternoon Underprediction. These two variables recorded the level of underprediction made by the models.
Remember: Underprediction is the worst kind of error for Aquaservice as these scenarios require trucks to return to the warehouse and reload before completing their deliveries.
Using the interactive charts inside the project, the Aquaservice team filtered the data to select only routes where their model made an underprediction in the morning or afternoon. Graphext then immediately highlighted the variables that best defined these segments; significant variables.
When you filter data, Graphext automatically calculates the
significant variables
that define your selection
.
The relevance of a significant variable is based on a number reflecting its influence on the selection. This number is calculated based on a measure of the difference between the values inside your selection and the values in the entire dataset.
David and the team found that the type of customer - residential vs corporate - had a huge impact on defining the difference between routes with underprediction and routes without underprediction.
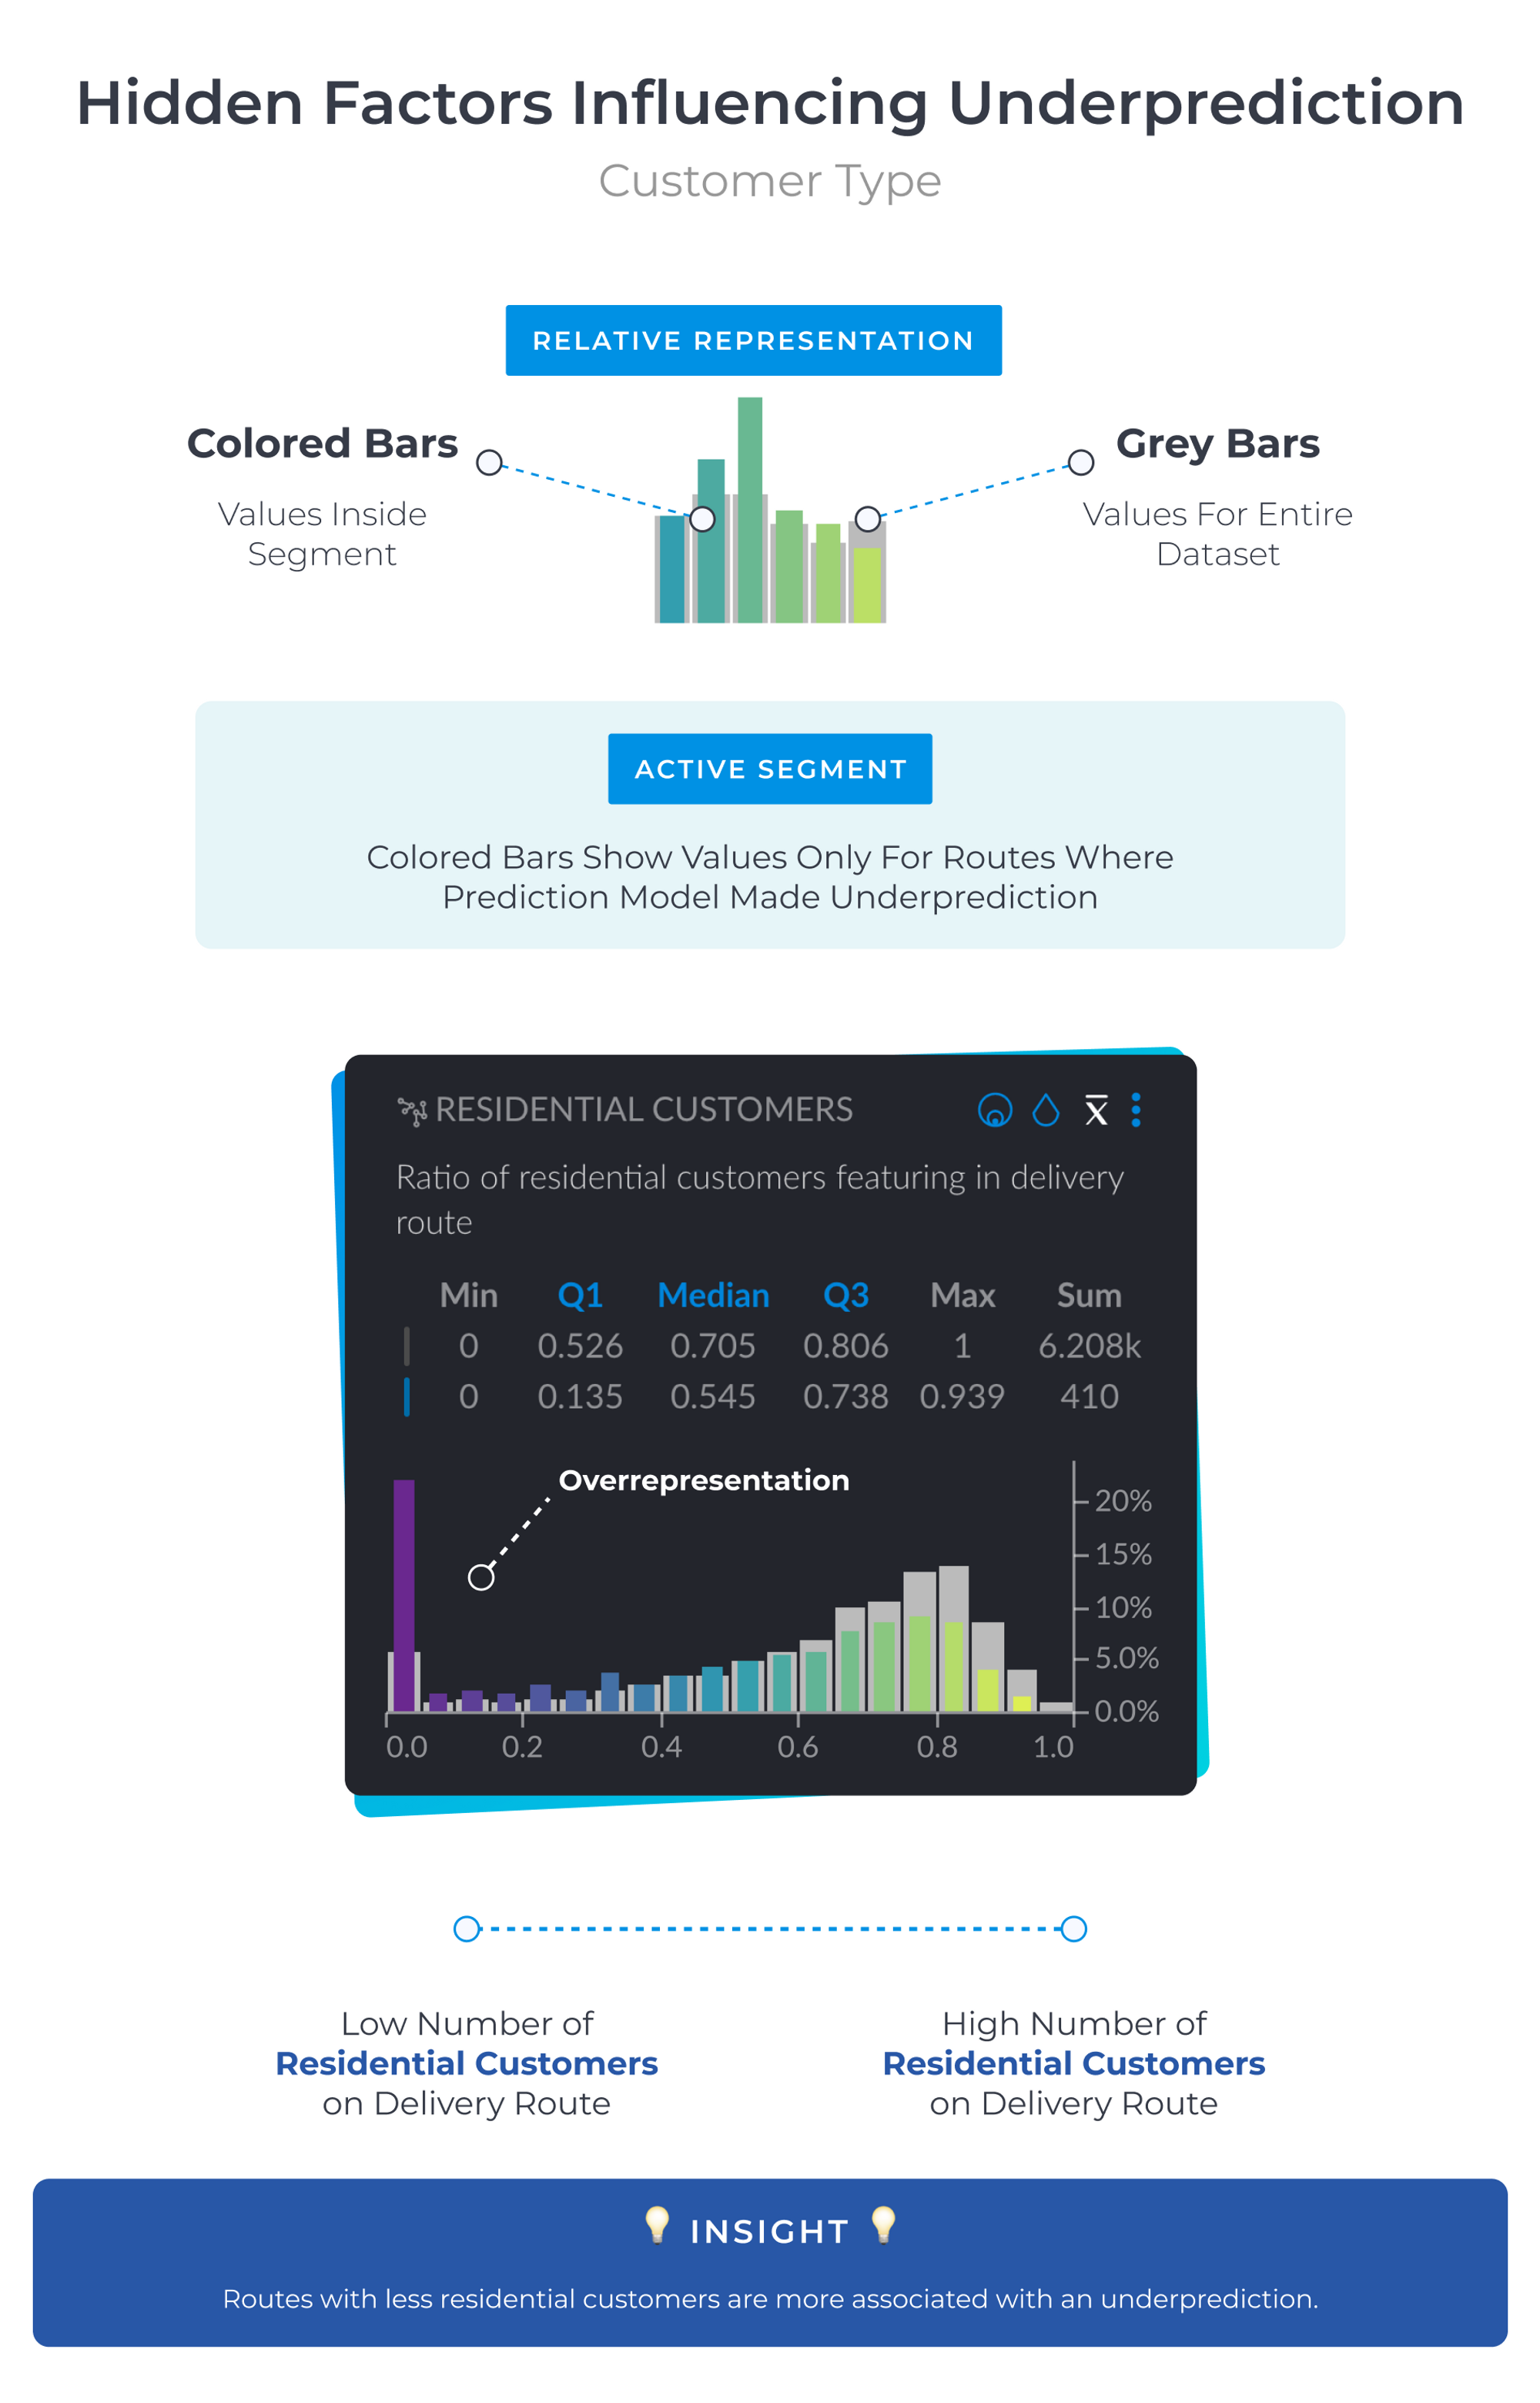
The project exposed that model underprediction was much more likely when a route featured a high number of corporate orders. As seen in the visualisation above, more residential customers in a delivery route helps to bring down the probability of underprediction. In short, demand from residential customers is easier to forecast than corporate demand.
Graphext has made it possible to detect certain routes accumulating the most under prediction - which we found were directly related to the type of customer and type of contract. Because of this, we've been able to adjust and add new variables related to customer type
.- David Gurrea, Aquaservice Data Scientist
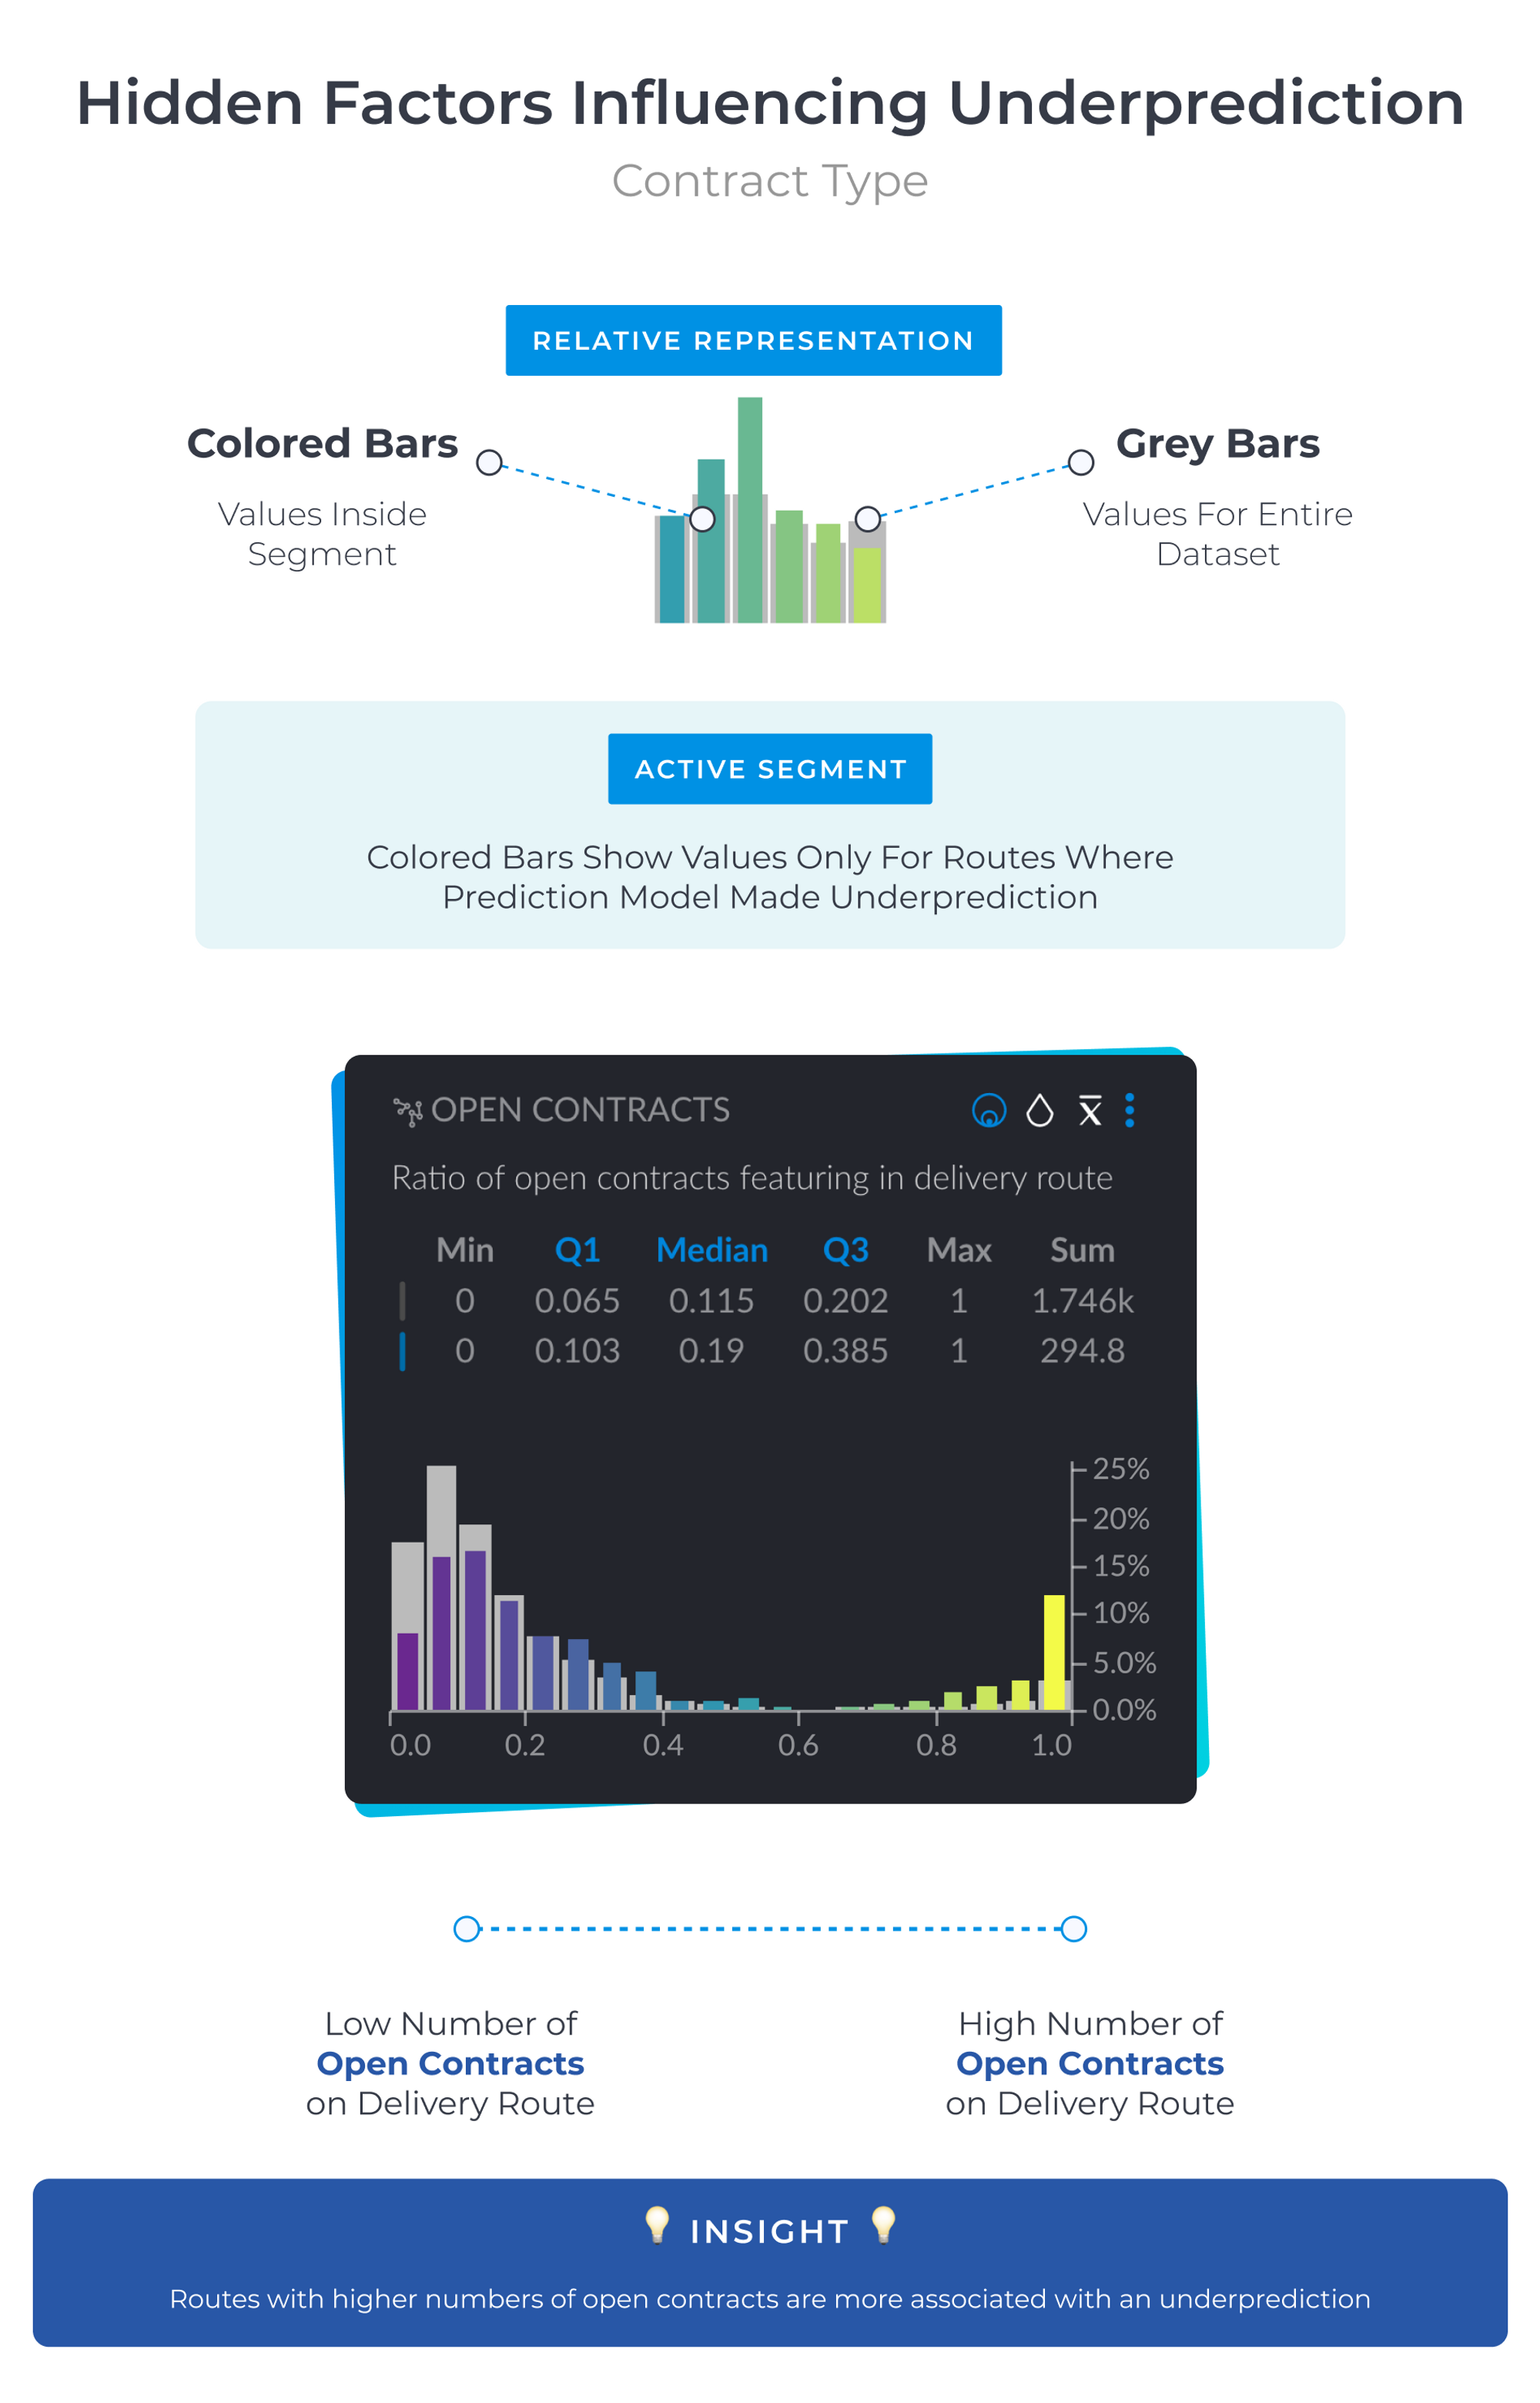
Residential and corporate customers tend to have different contracts. Closed contracts are ones where bottle numbers are almost fixed and are generally preferred by residential customers. Open contracts work on demand and are more popular with corporate customers. For the data scientists at Aquaservice, this raised a hypothesis; the contract type significantly influences whether the prediction model will make an underprediction.
David told us that sure enough - contract type was high in the sequence of Graphext's significant variables influencing the chosen data segment.
Using The Project To Improve Aquaservice's Prediction Model
With clear insights about the impact of the type of customer and contract on their model's predictions, the Aquaservice data science team could move forward and optimize their model.
Meaningful improvements that have led on from the project firstly concern the structure of the data that is fed into the prediction model. Aquaservice has started to use a new database with historical and disaggregated data for each customer - this used to be run on daily, aggregated data.
Ultimately this project has reduced the number of routes associated with underprediction. We've been able to lower the number of routes where drivers did not have enough bottles as well as lowering the number of routes with too many bottles.
- David Gurrea, Aquaservice Data ScientistDavid Gurrea, Aquaservice Data Scientist
This structural change allows Aquaservice's model to better understand the variations in consumer demand using historical data that records the requirements of different customer and contract types.
But because the models also consider whether the route takes place in the morning or afternoon - the structural changes made to the dataset also needed to take this into account.
Disaggregating the data further - by customer type and by the time of day - has provided space for their model to understand not only how the type of customer affects demand forecasting but also how delivery estimates vary depending on the time of day they are scheduled for.