

How we use Graphext to predict who will pay for Graphext with lead scoring
At Graphext, we proudly serve thousands of free users. This not only allows us to reach a wider audience more rapidly but also helps us uncover innovative use cases we hadn't previously considered. By serving these users, we can reduce our marketing costs and empower students, NGOs, journalists, and other individuals with limited resources to make a positive impact using data.
We also need to pay our salaries, however, which we do in part by finding potential commercial users amongst our signups and converting them into paying customers. But, not all users are equal – some are more likely to convert than others, which is why lead scoring is important not only for us but most software companies these days. By implementing a good lead scoring strategy we can prioritize our efforts on the most promising leads and improve the overall conversion rates.
Defining leads
In the simplest of terms, a "good lead" is someone who is likely to end up buying your product. But, if relatively few people are buying currently (because your conversion rate is still low, for example), this might not work well as a target for building a prediction model. It can be even harder if your customers are all very different from each other, since you might not have enough information to identify the different potential conversion patterns. One way around this problem is to use other variables as proxies for probable conversion to predict who will buy from you in the future.
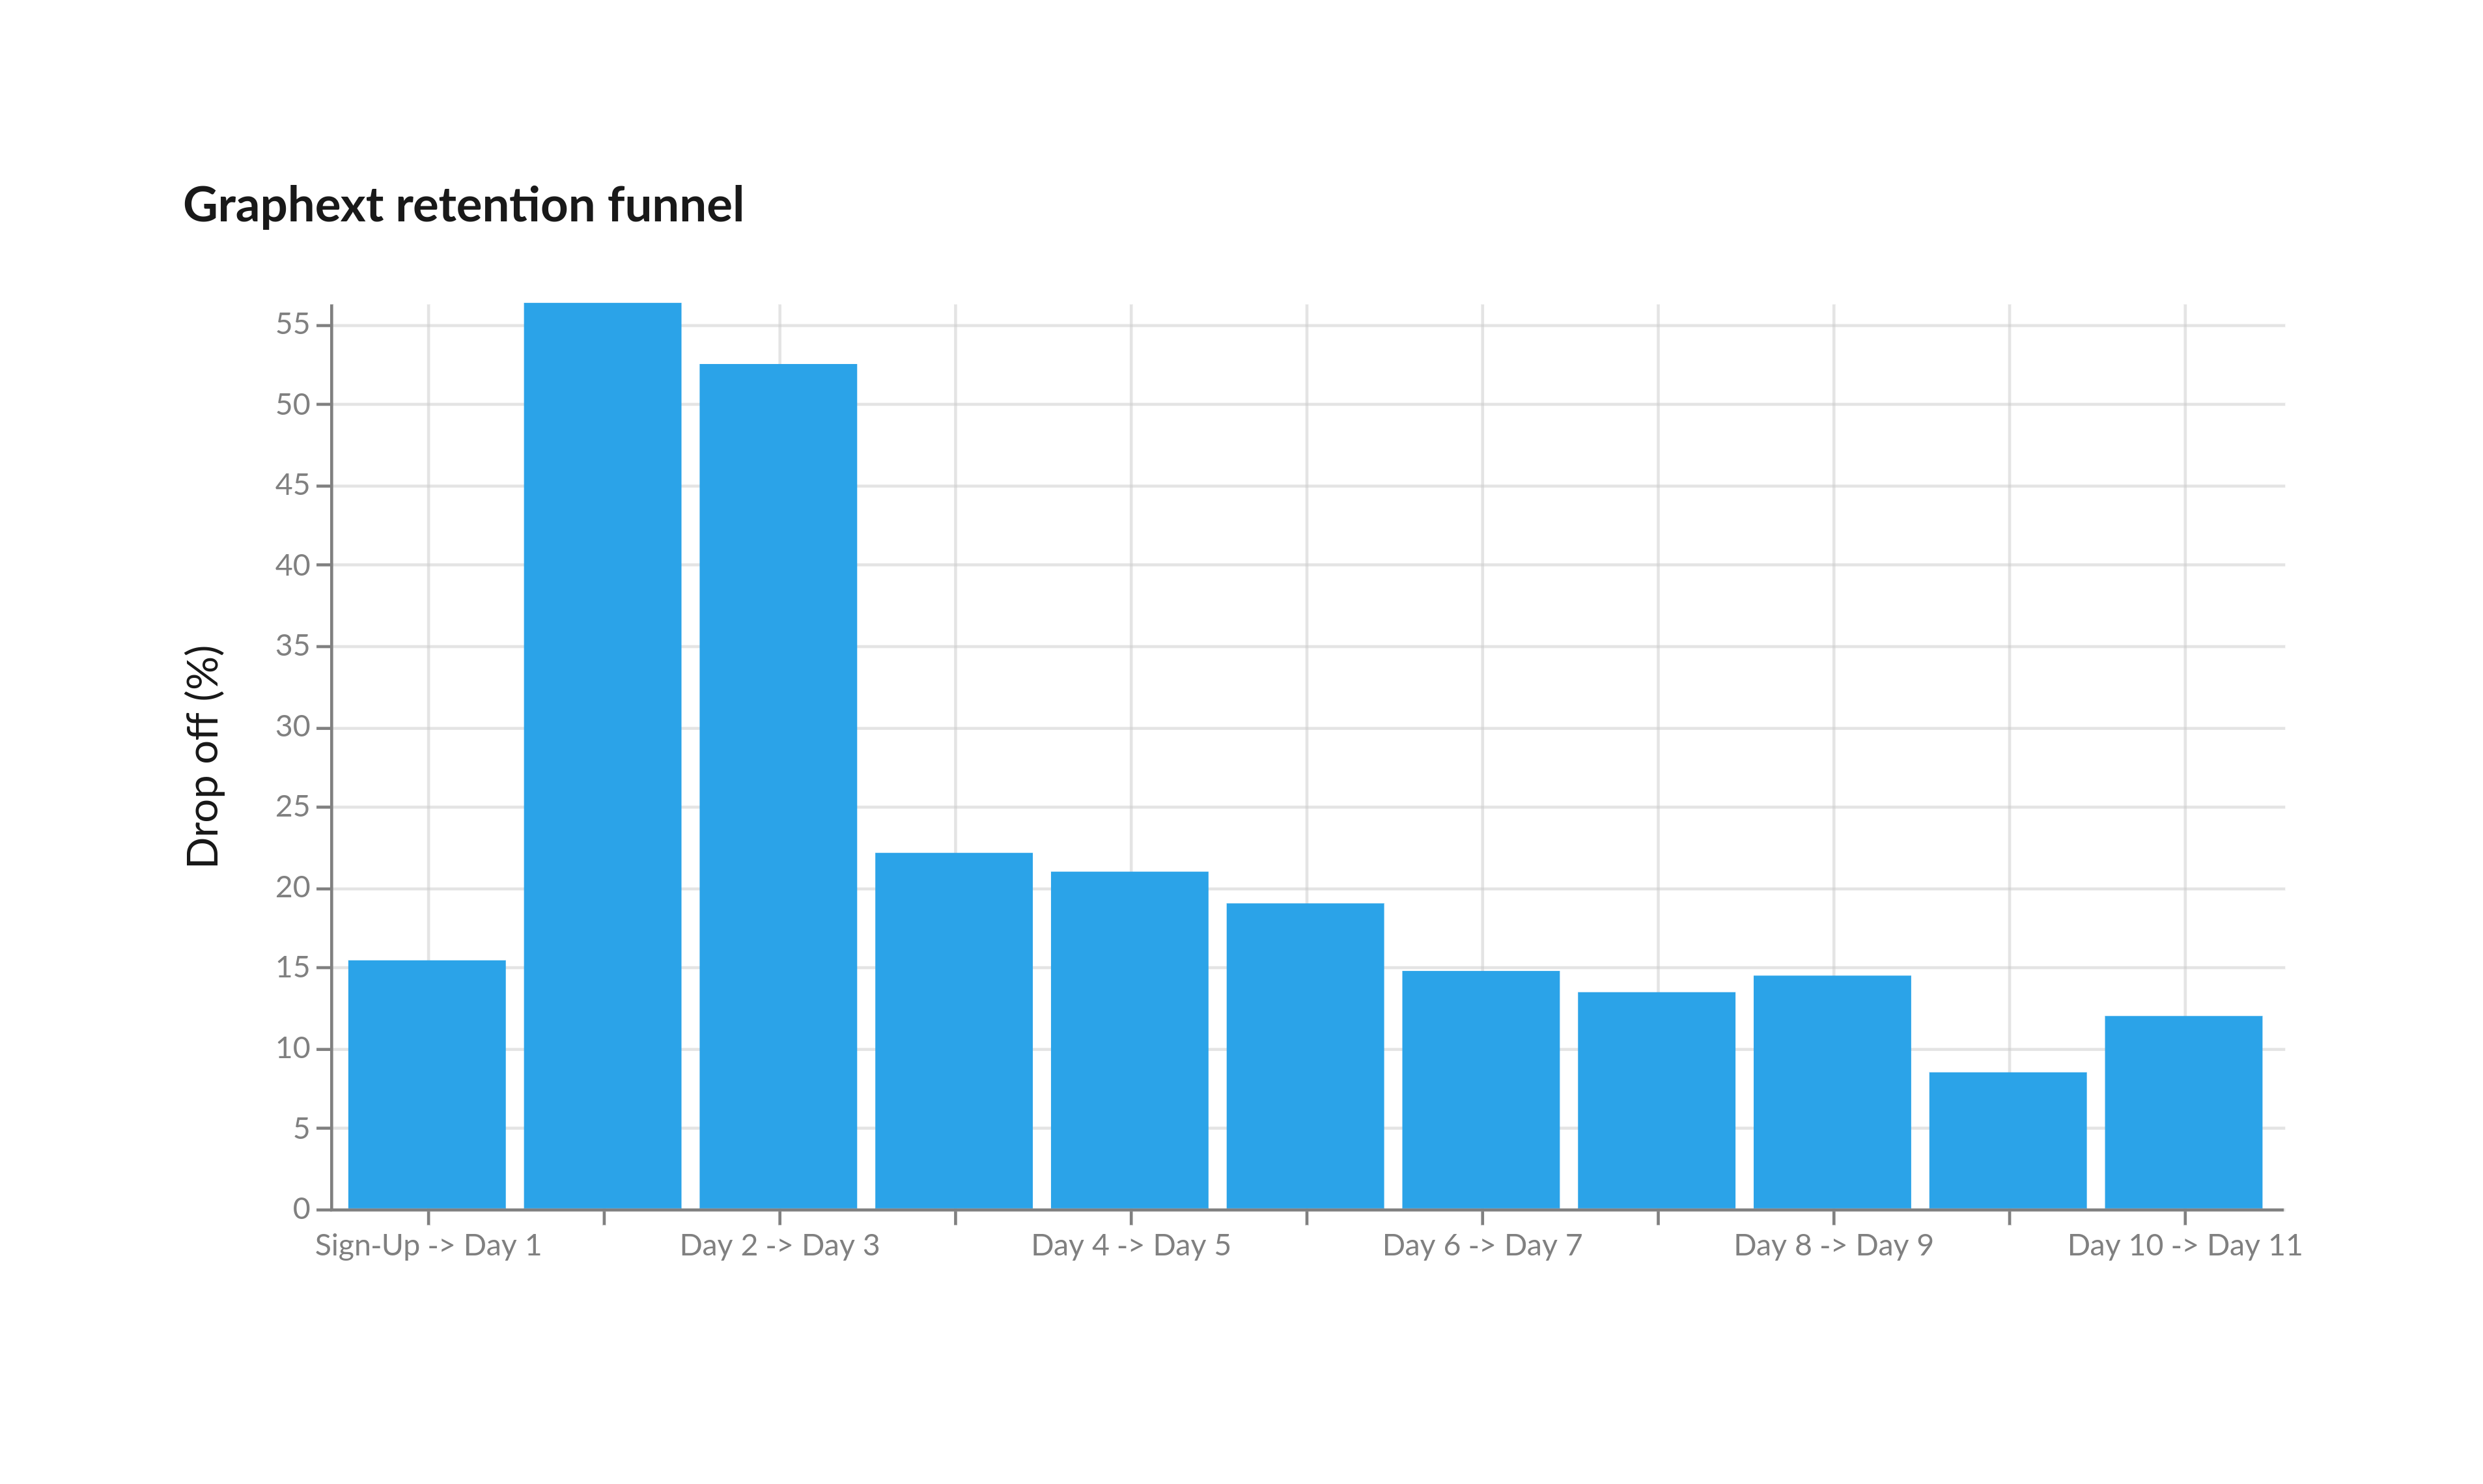
At Graphext, in particular, we have observed how engagement is a very strong indicator of a user's potential to convert to a paying customer. As such, our lead scoring project focuses on ranking users based on their likelihood to remain engaged with the tool for at least a certain time window. More specifically, one of our objectives is identifying users who remain active for at least 3 different days after initial sign up (see Figure below).
Gathering Data
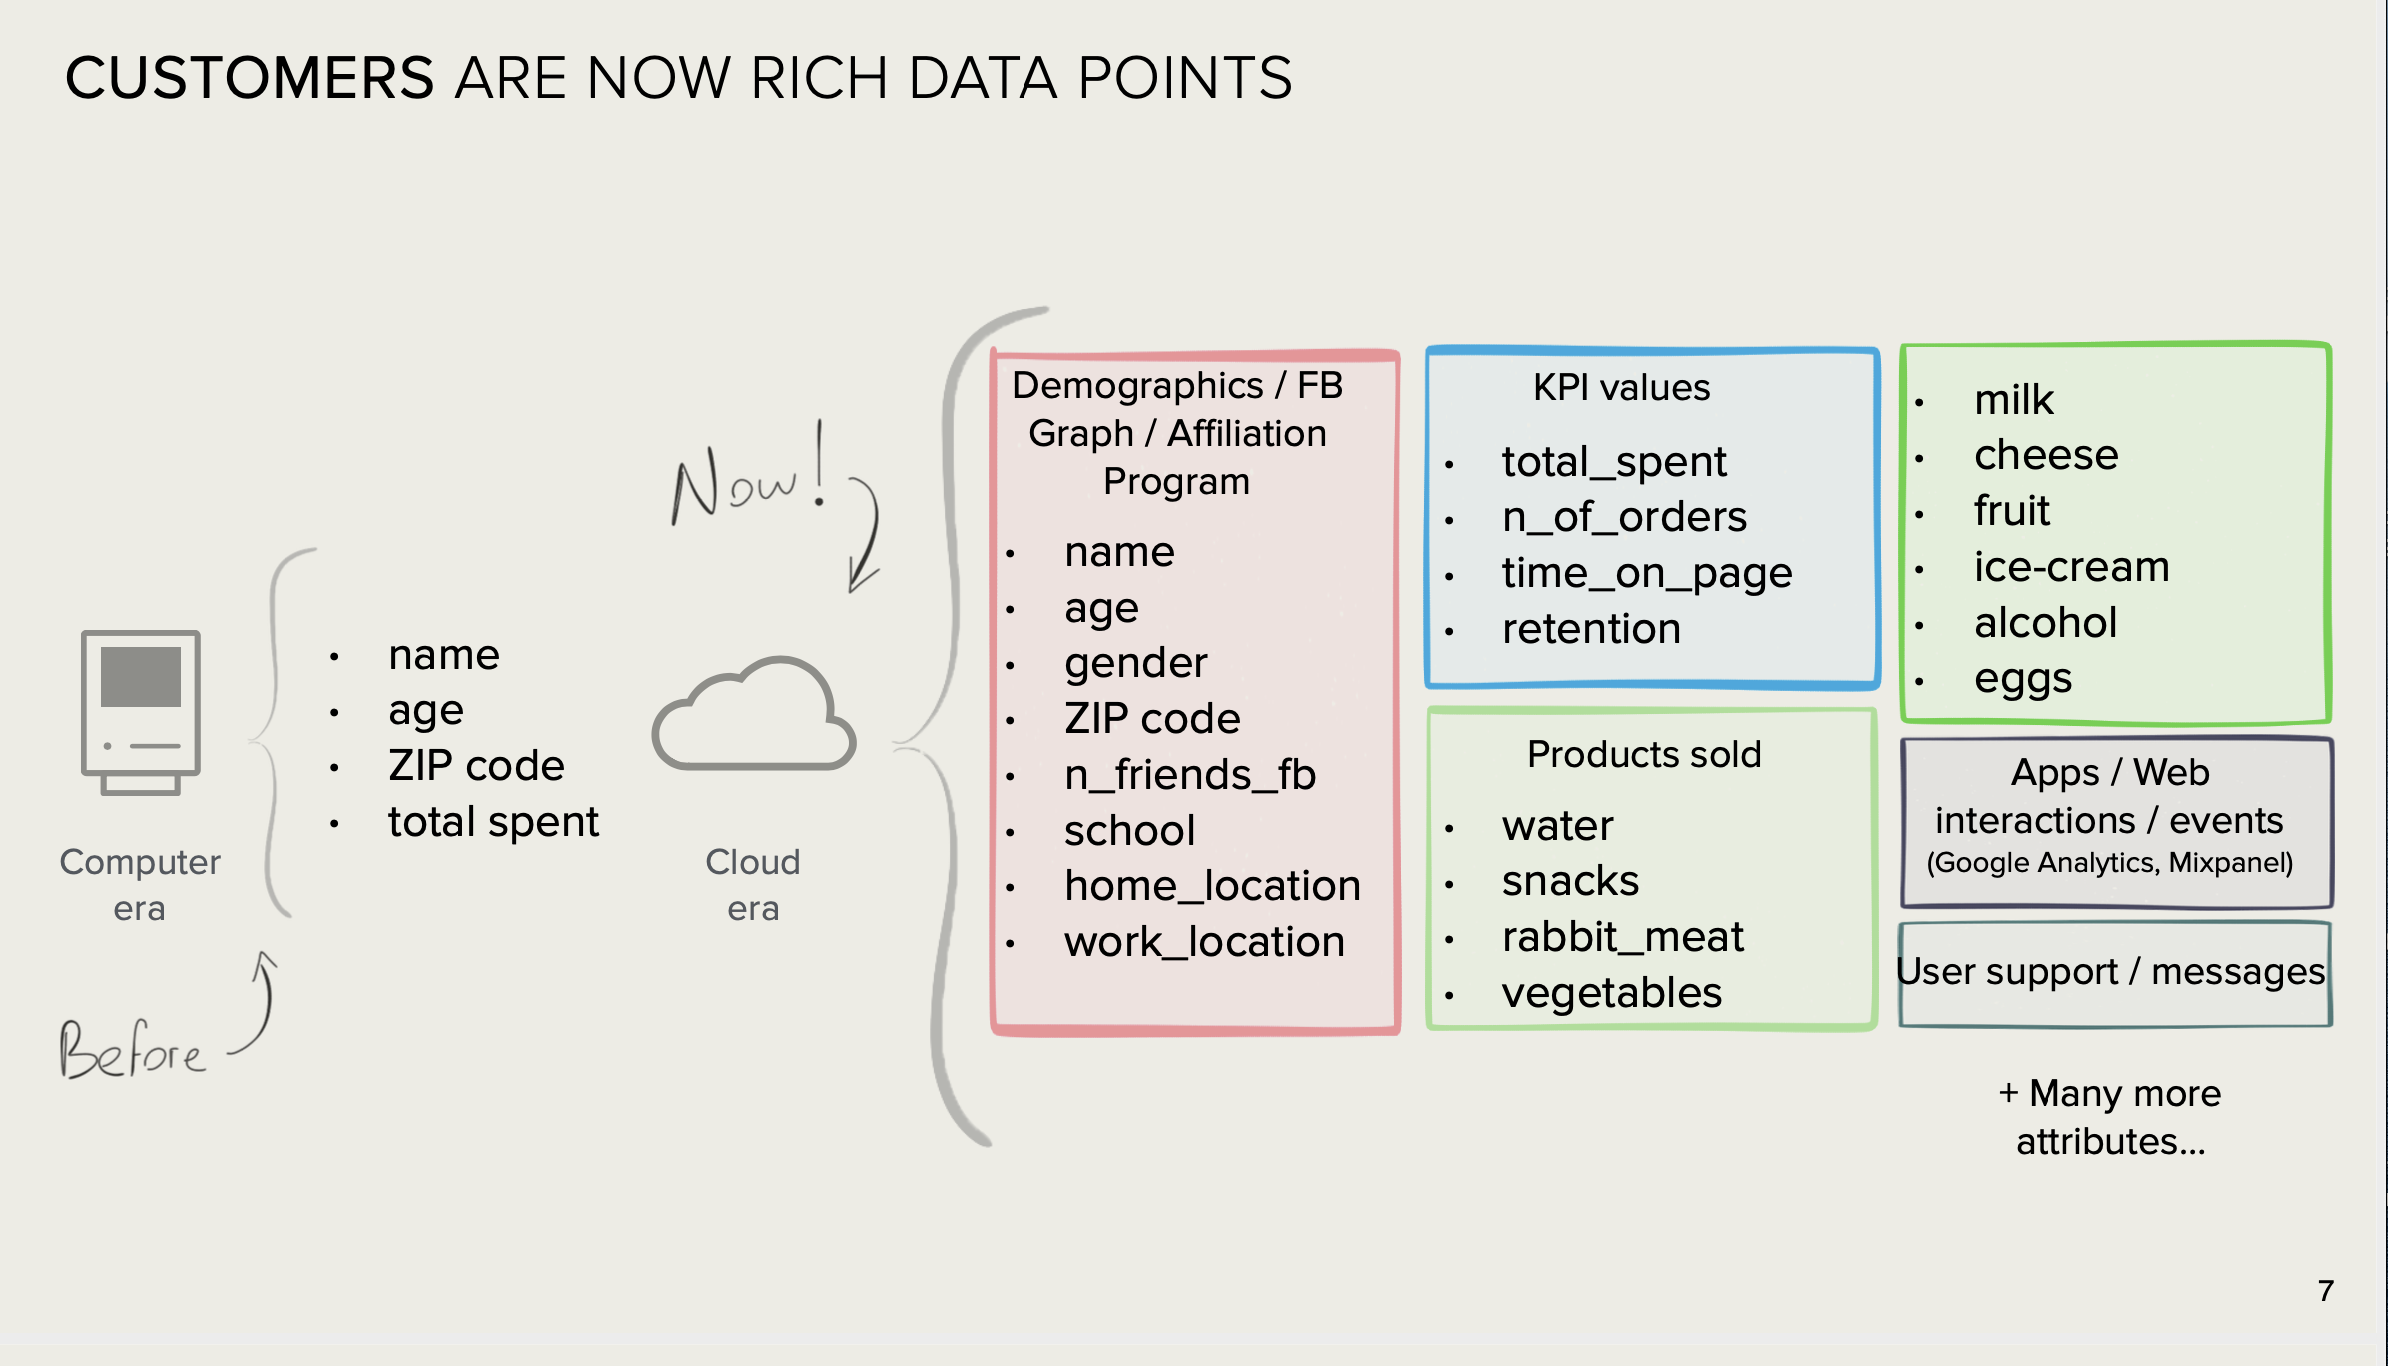
An important aspect of creating a successful lead scoring algorithm is the identification and gathering of the best kinds of information available about our users, and which to include in our model. What we measure about leads can make or break the difference between an accurate lead score and a poor one. Combining the right behavioral variables with attributes obtained from sign-up questions, demographics etc., allows us to more effectively qualify our user base.
Having a structured data stack helps gathering data from different sources, such as website and app events, CRM and internal data. This, in turn, is important to be able to test different combinations of variables and their impact on the performance of the model. Graphext makes it particularly easy to iterate over sets of such variables and to measure their impact on prediction models.
Time is a decisive factor when it comes to scoring new sign-ups. Therefore, we limit the behavioural data we use for the lead scoring model to the first day of activity. This enables us to activate or perform business efforts towards new leads as soon as possible.
In Graphext it is possible to group variables into meaningful subsets, making the process of exploration easier by focusing on specific kinds of features at different times. In this case we group variables according to their nature, such as usage variables, sign-up form questions, or manual qualification variables.
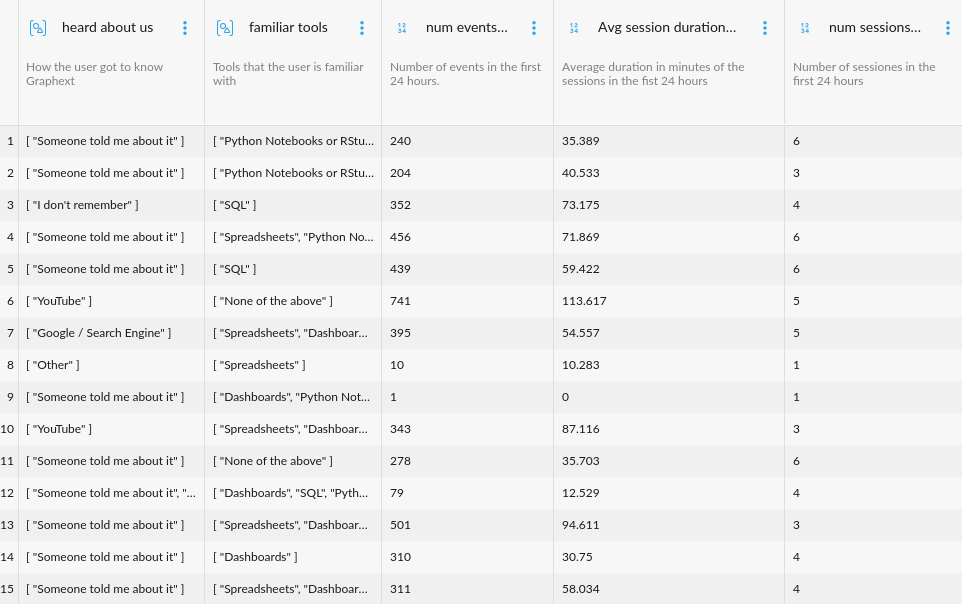
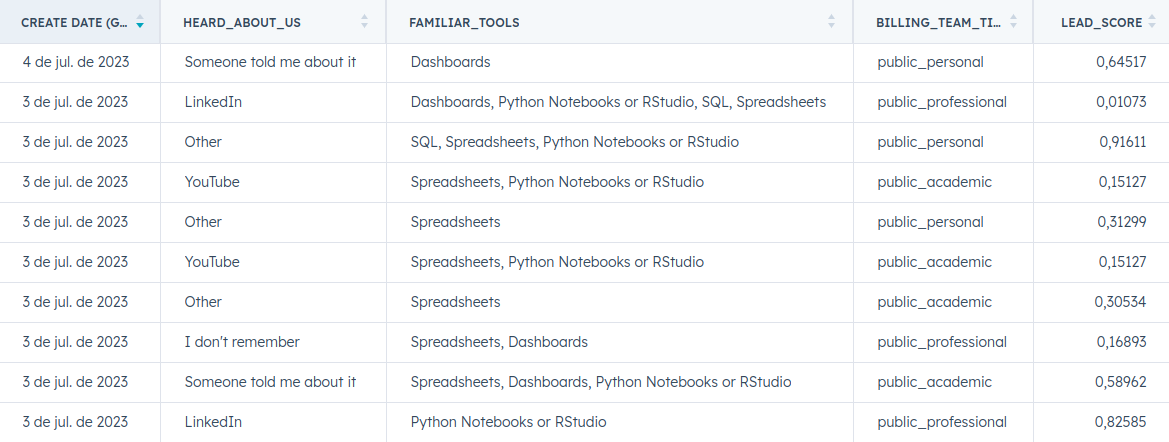
Some of the features we use to train the lead scoring model include:
- Engagement features in first 24 hours of activity
- Number of events
- Number of unique events
- Number of sessions
- Average session duration
- Number of projects run
- User sign-up answers
- User is technical (familiar with Python os SQL)
- Use cases
- How the user got to know us (referral, social networks, seo)
- Professional, personal or academic use
To prepare the dataset we use to train our lead scoring model, we employ dbt, a powerful data modelling tool. With dbt we are able to combine data from multiple sources and perform basic feature engineering directly in our data lake. An advantage of using dbt is that it provides a standardised way of doing things, which leads to better re-utilization of data in other projects, easier collaboration at the modelling stage, and in general saves time and effort.
Before training a lead scoring model, a useful step to gain intuition is using Graphext to discover relevant correlations with respect to the conversion target. We can do so, for example, by selecting users who have historically remained engaged for at least three days and identifying the variables in which these users differ most from the rest. Here are some examples.
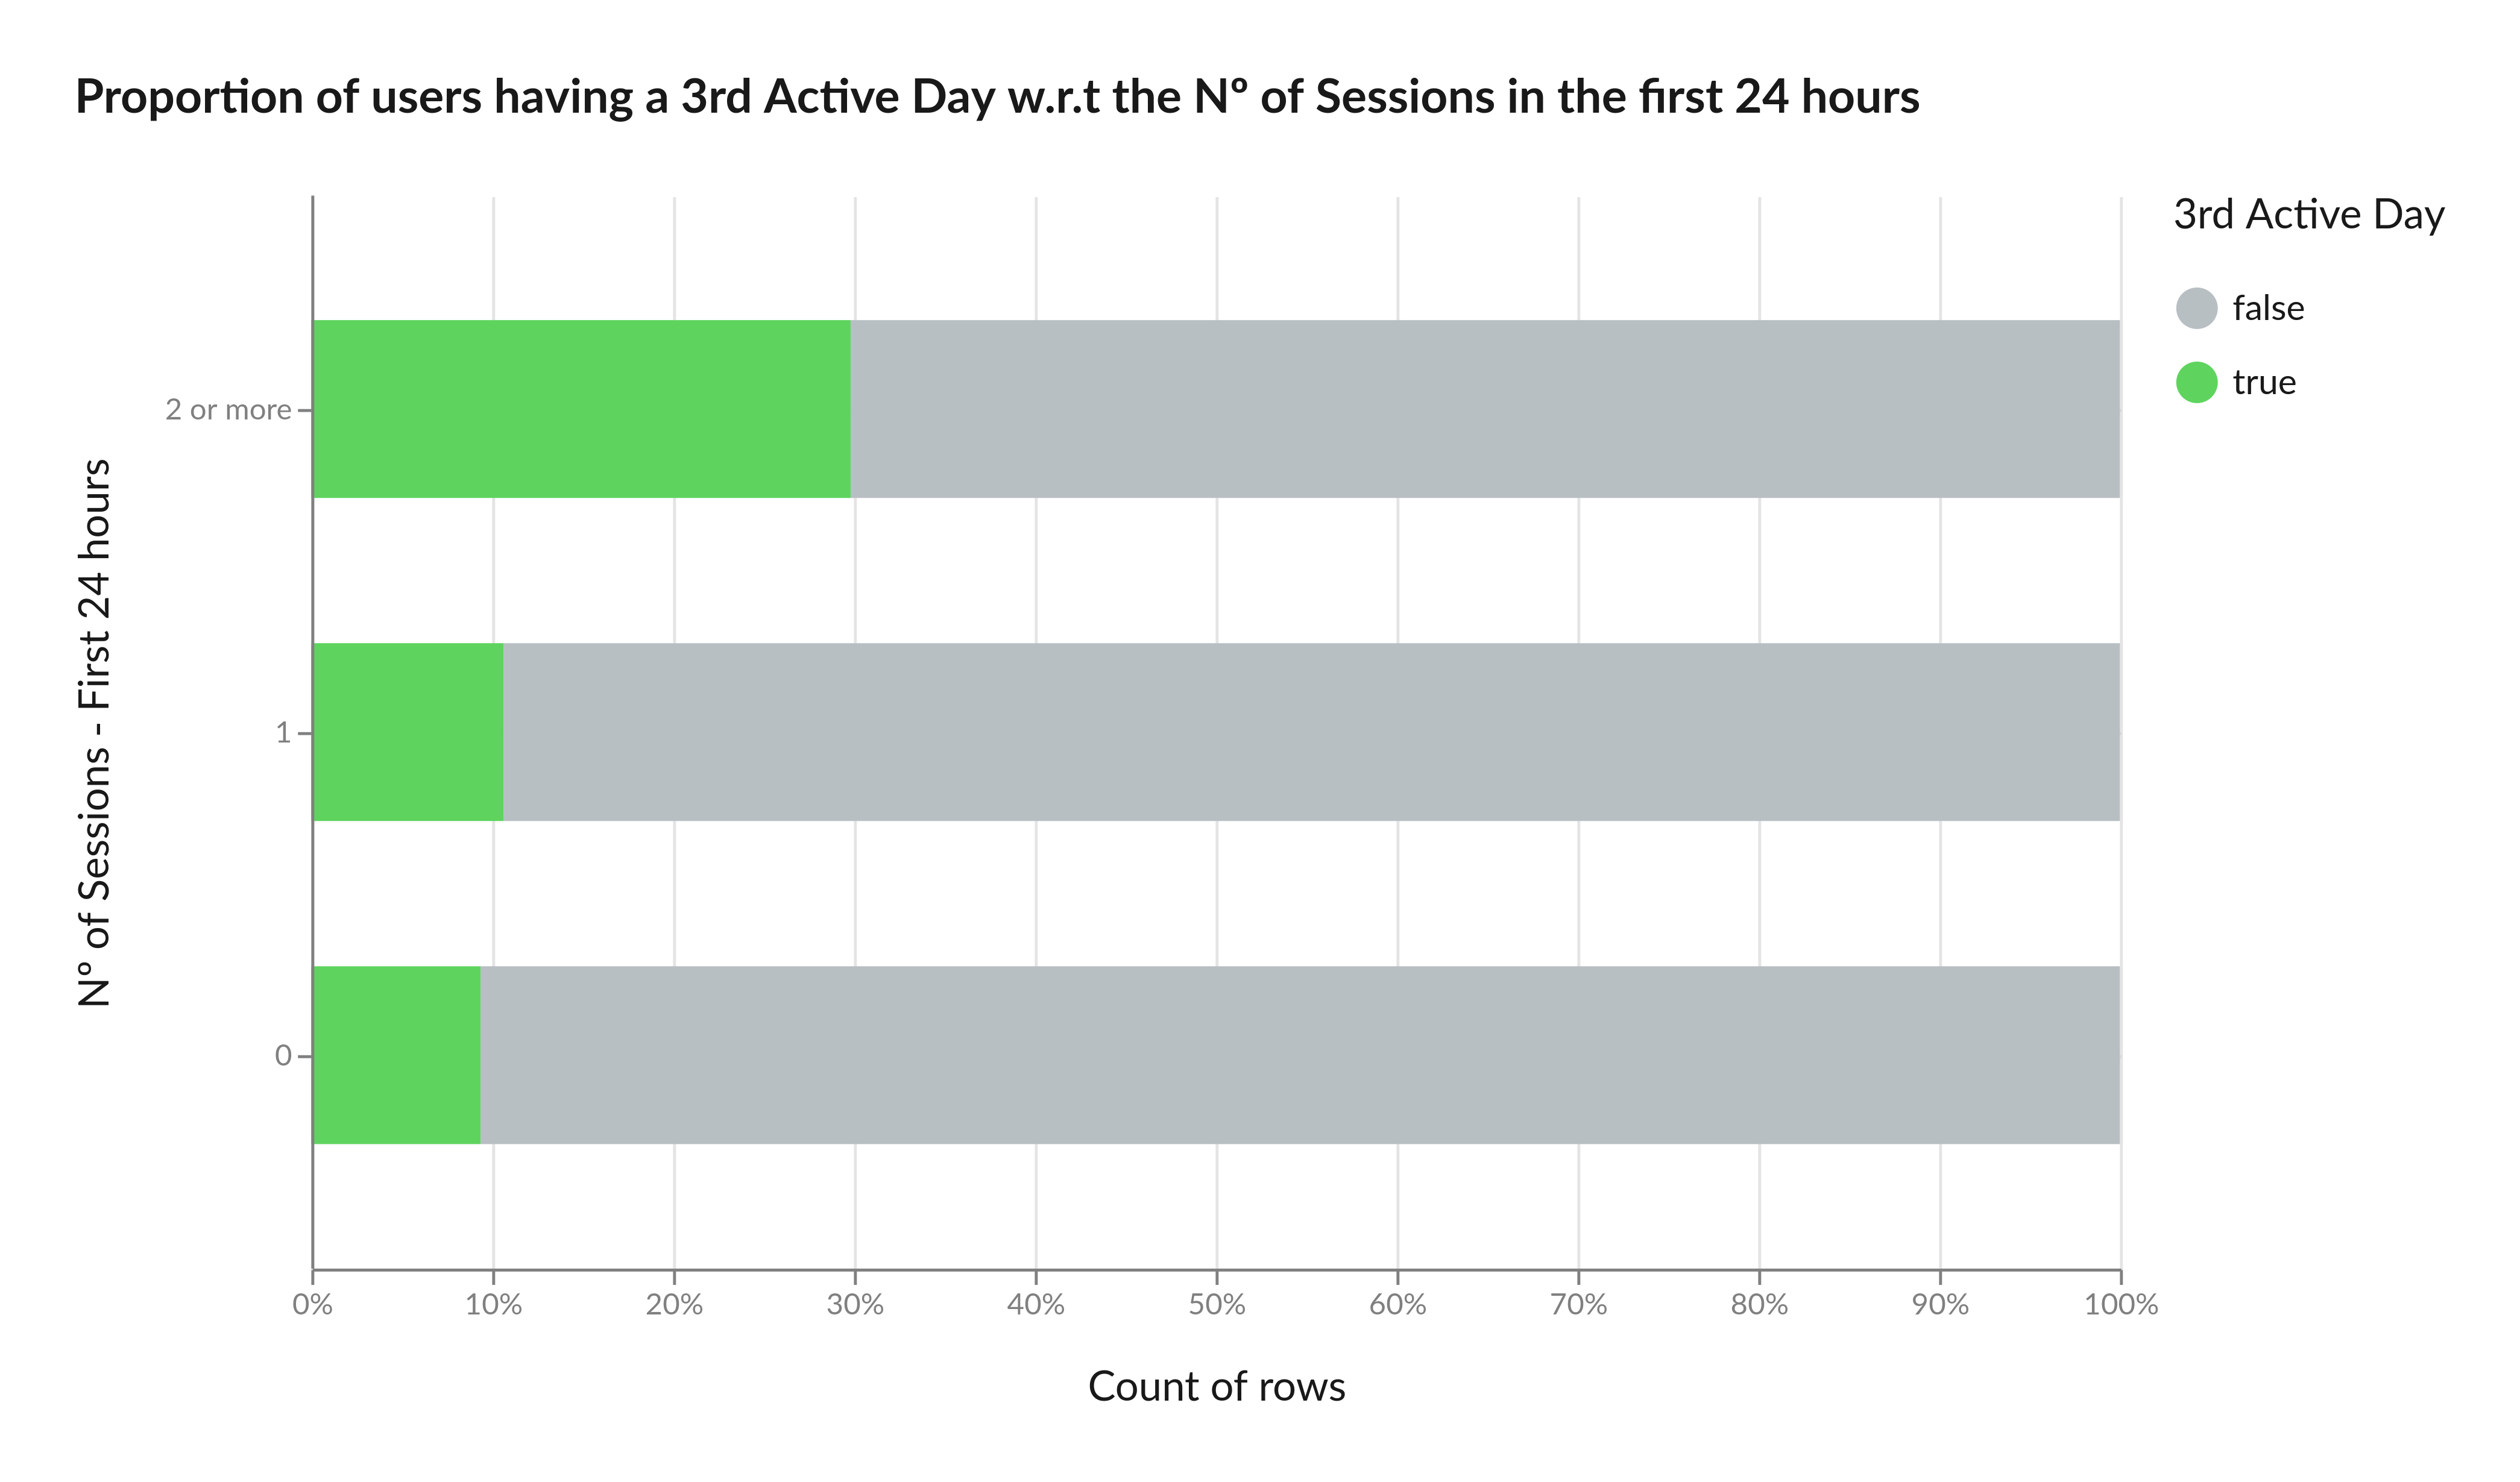
In Graphext, a session starts with the first event and ends after 30 minutes of inactivity. Any new event then triggers a new session. Amongst our leads the number of sessions in the first 24 hours after sign-up tends to be highly correlated with conversion. Users with two or more sessions on the first day, for example, are 98% more likely to convert on the third day of engagement.
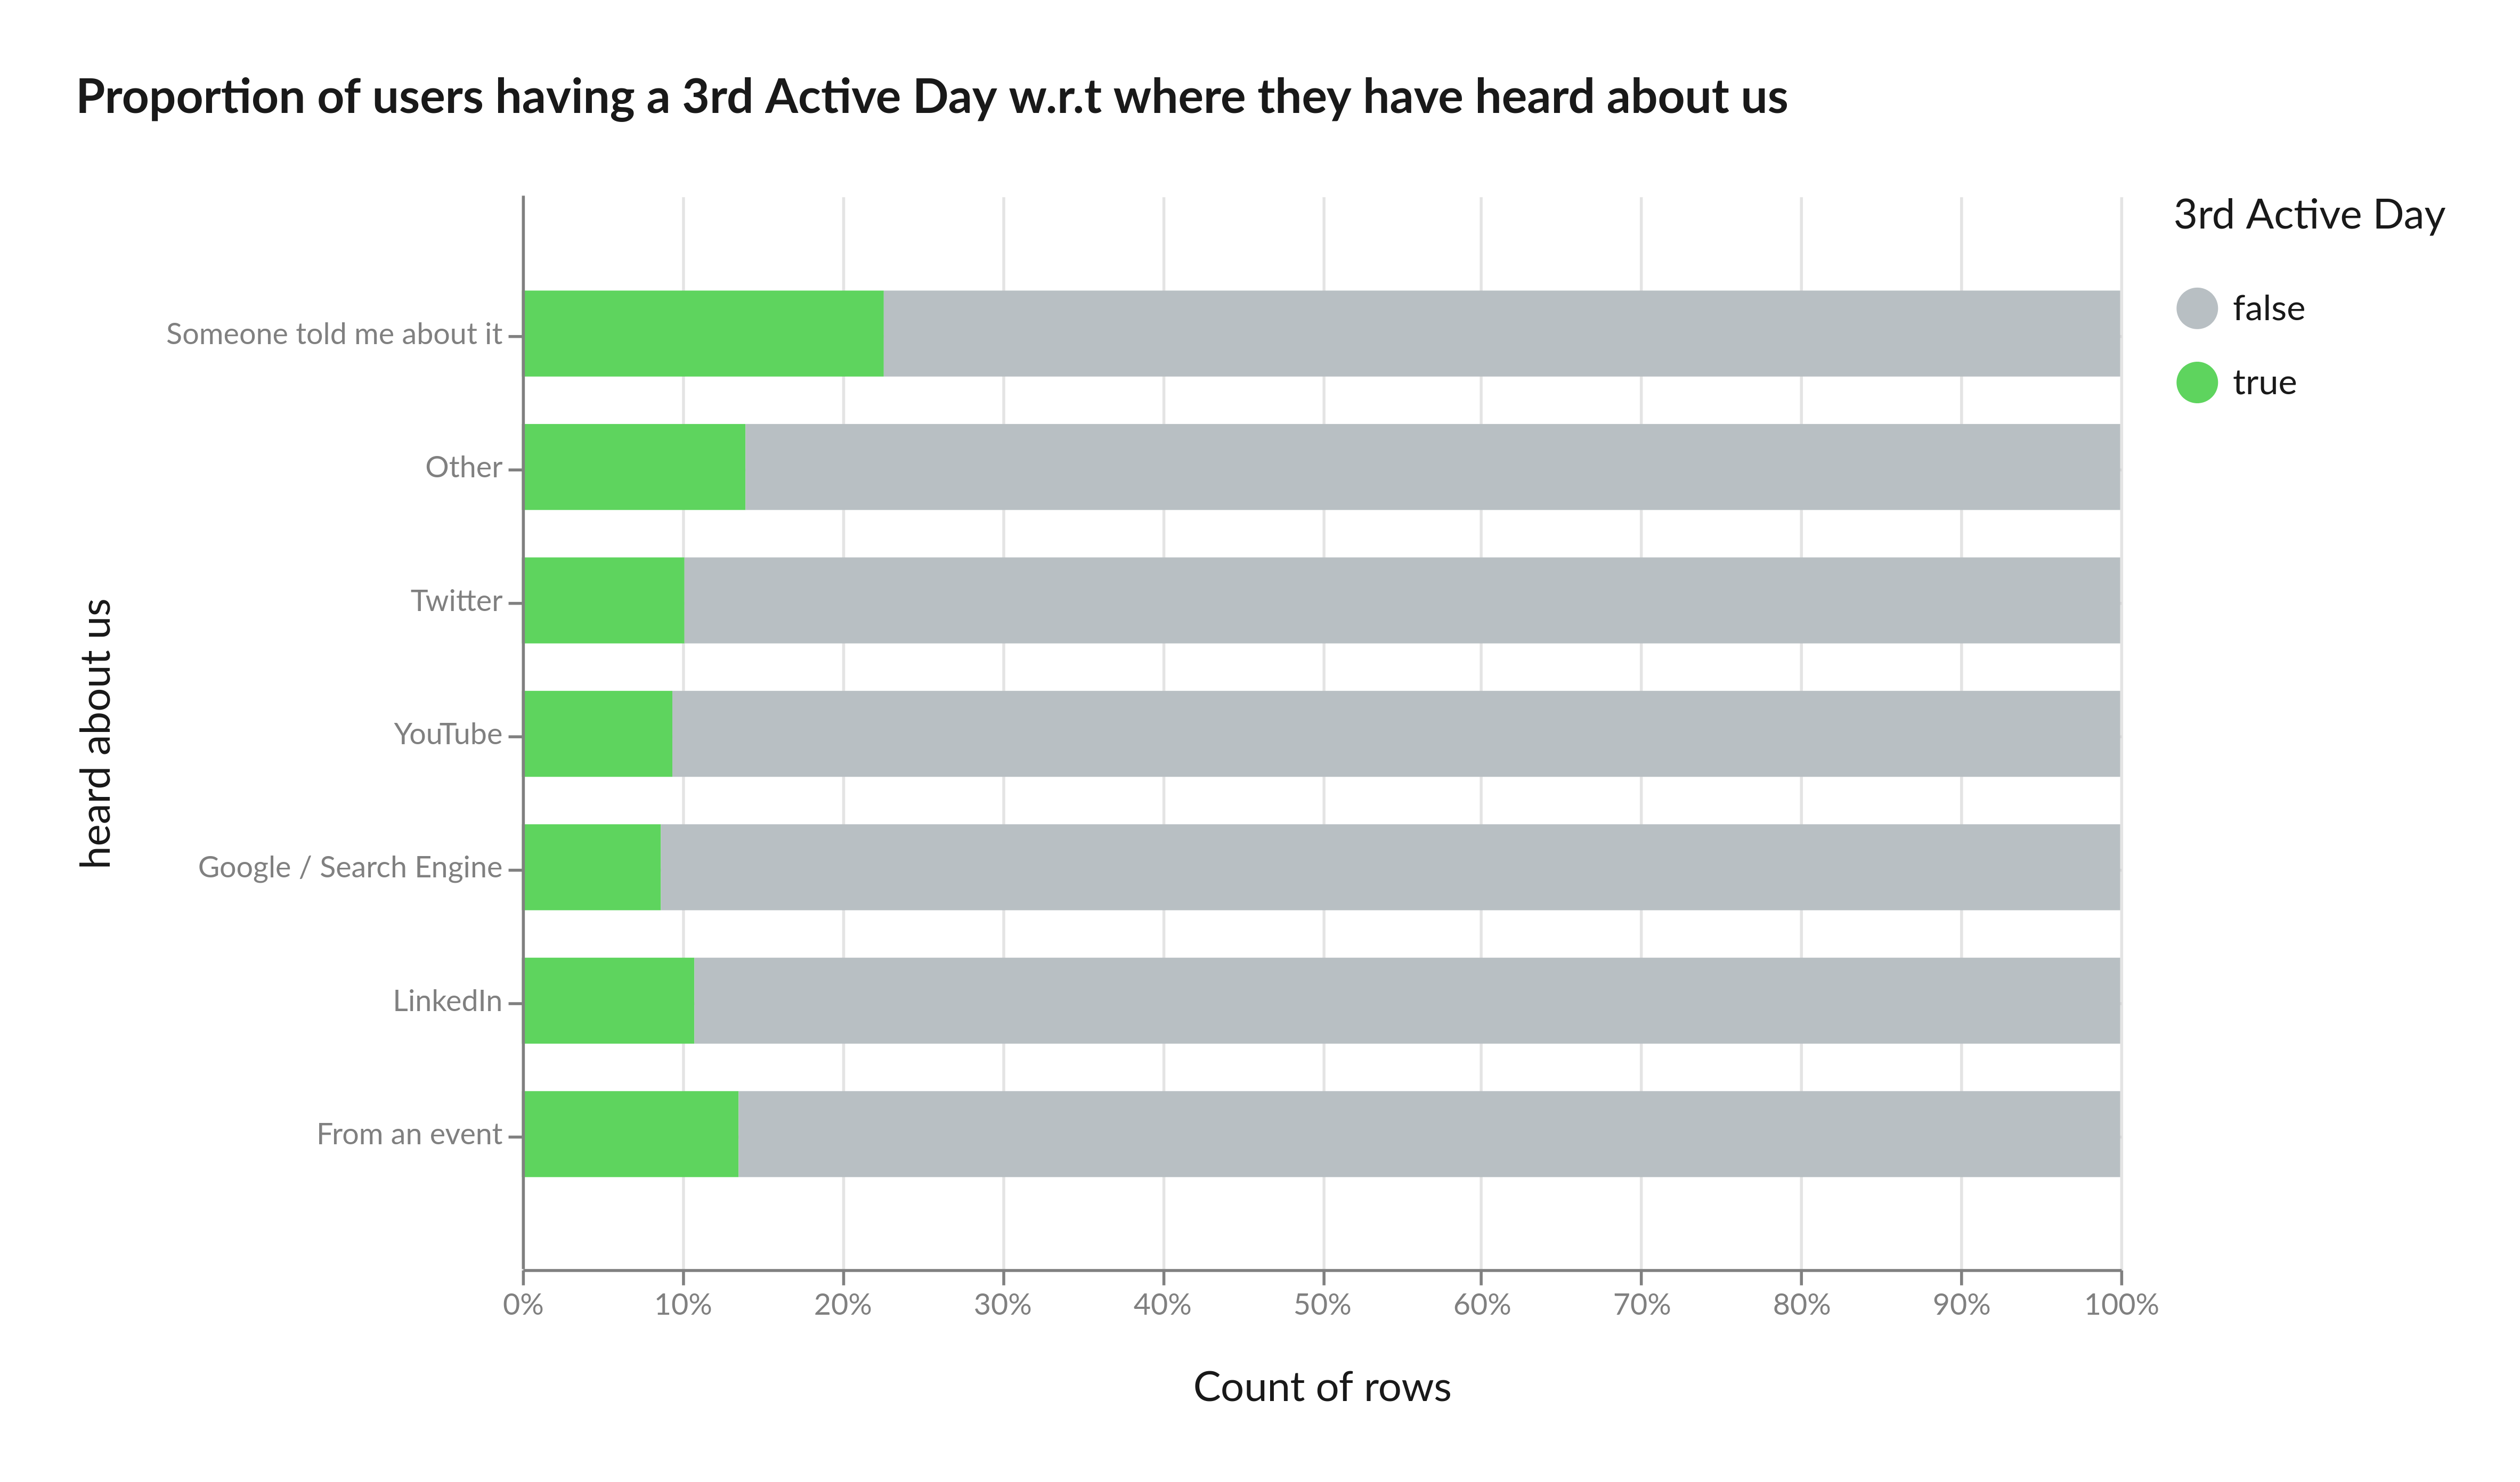
Another key finding is that users who learned about Graphext through word-of-mouth are 50% more likely to convert on the third day of activity. This highlights the importance of understanding how users find out about your product and leveraging that knowledge to increase conversions.
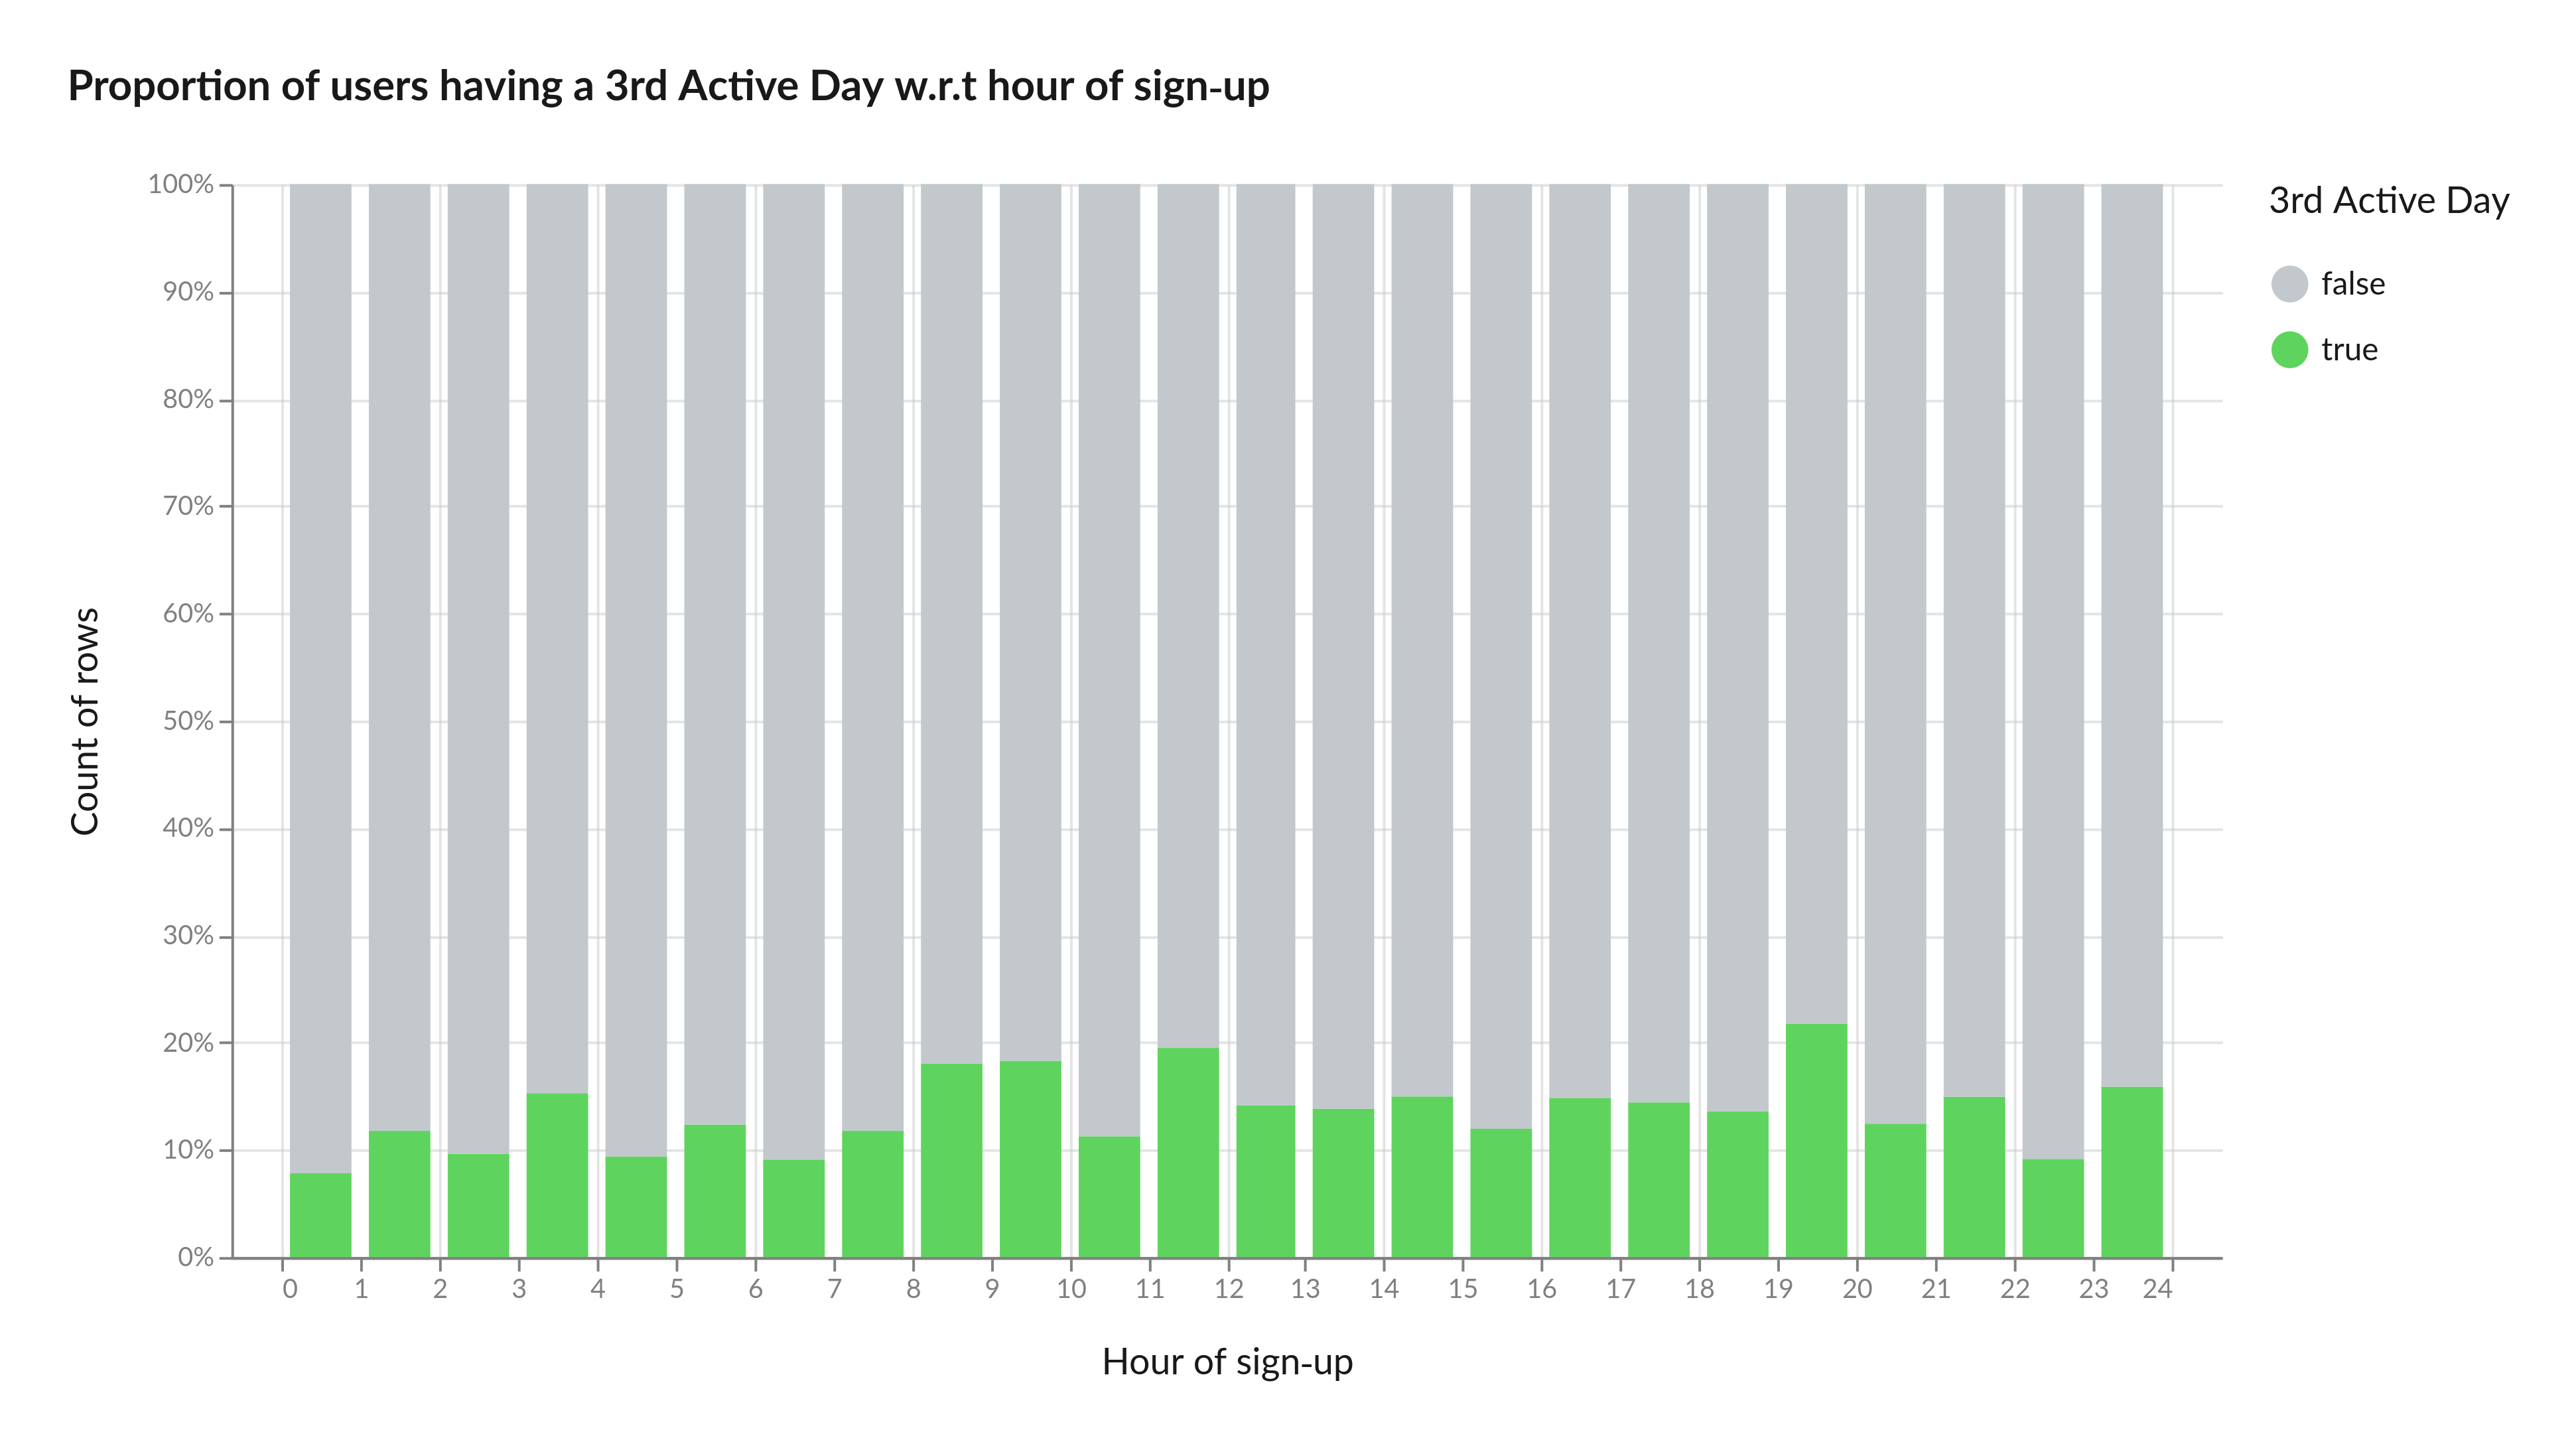
We also discovered some more unexpected insights, such as a correlation between the hour of sign-up and the probability of having a 3rd active day. Users signing-up between 8:00-10:00 in the morning and between 19:00 and 20:00 in the evening have higher chances of reaching a 3rd active day.
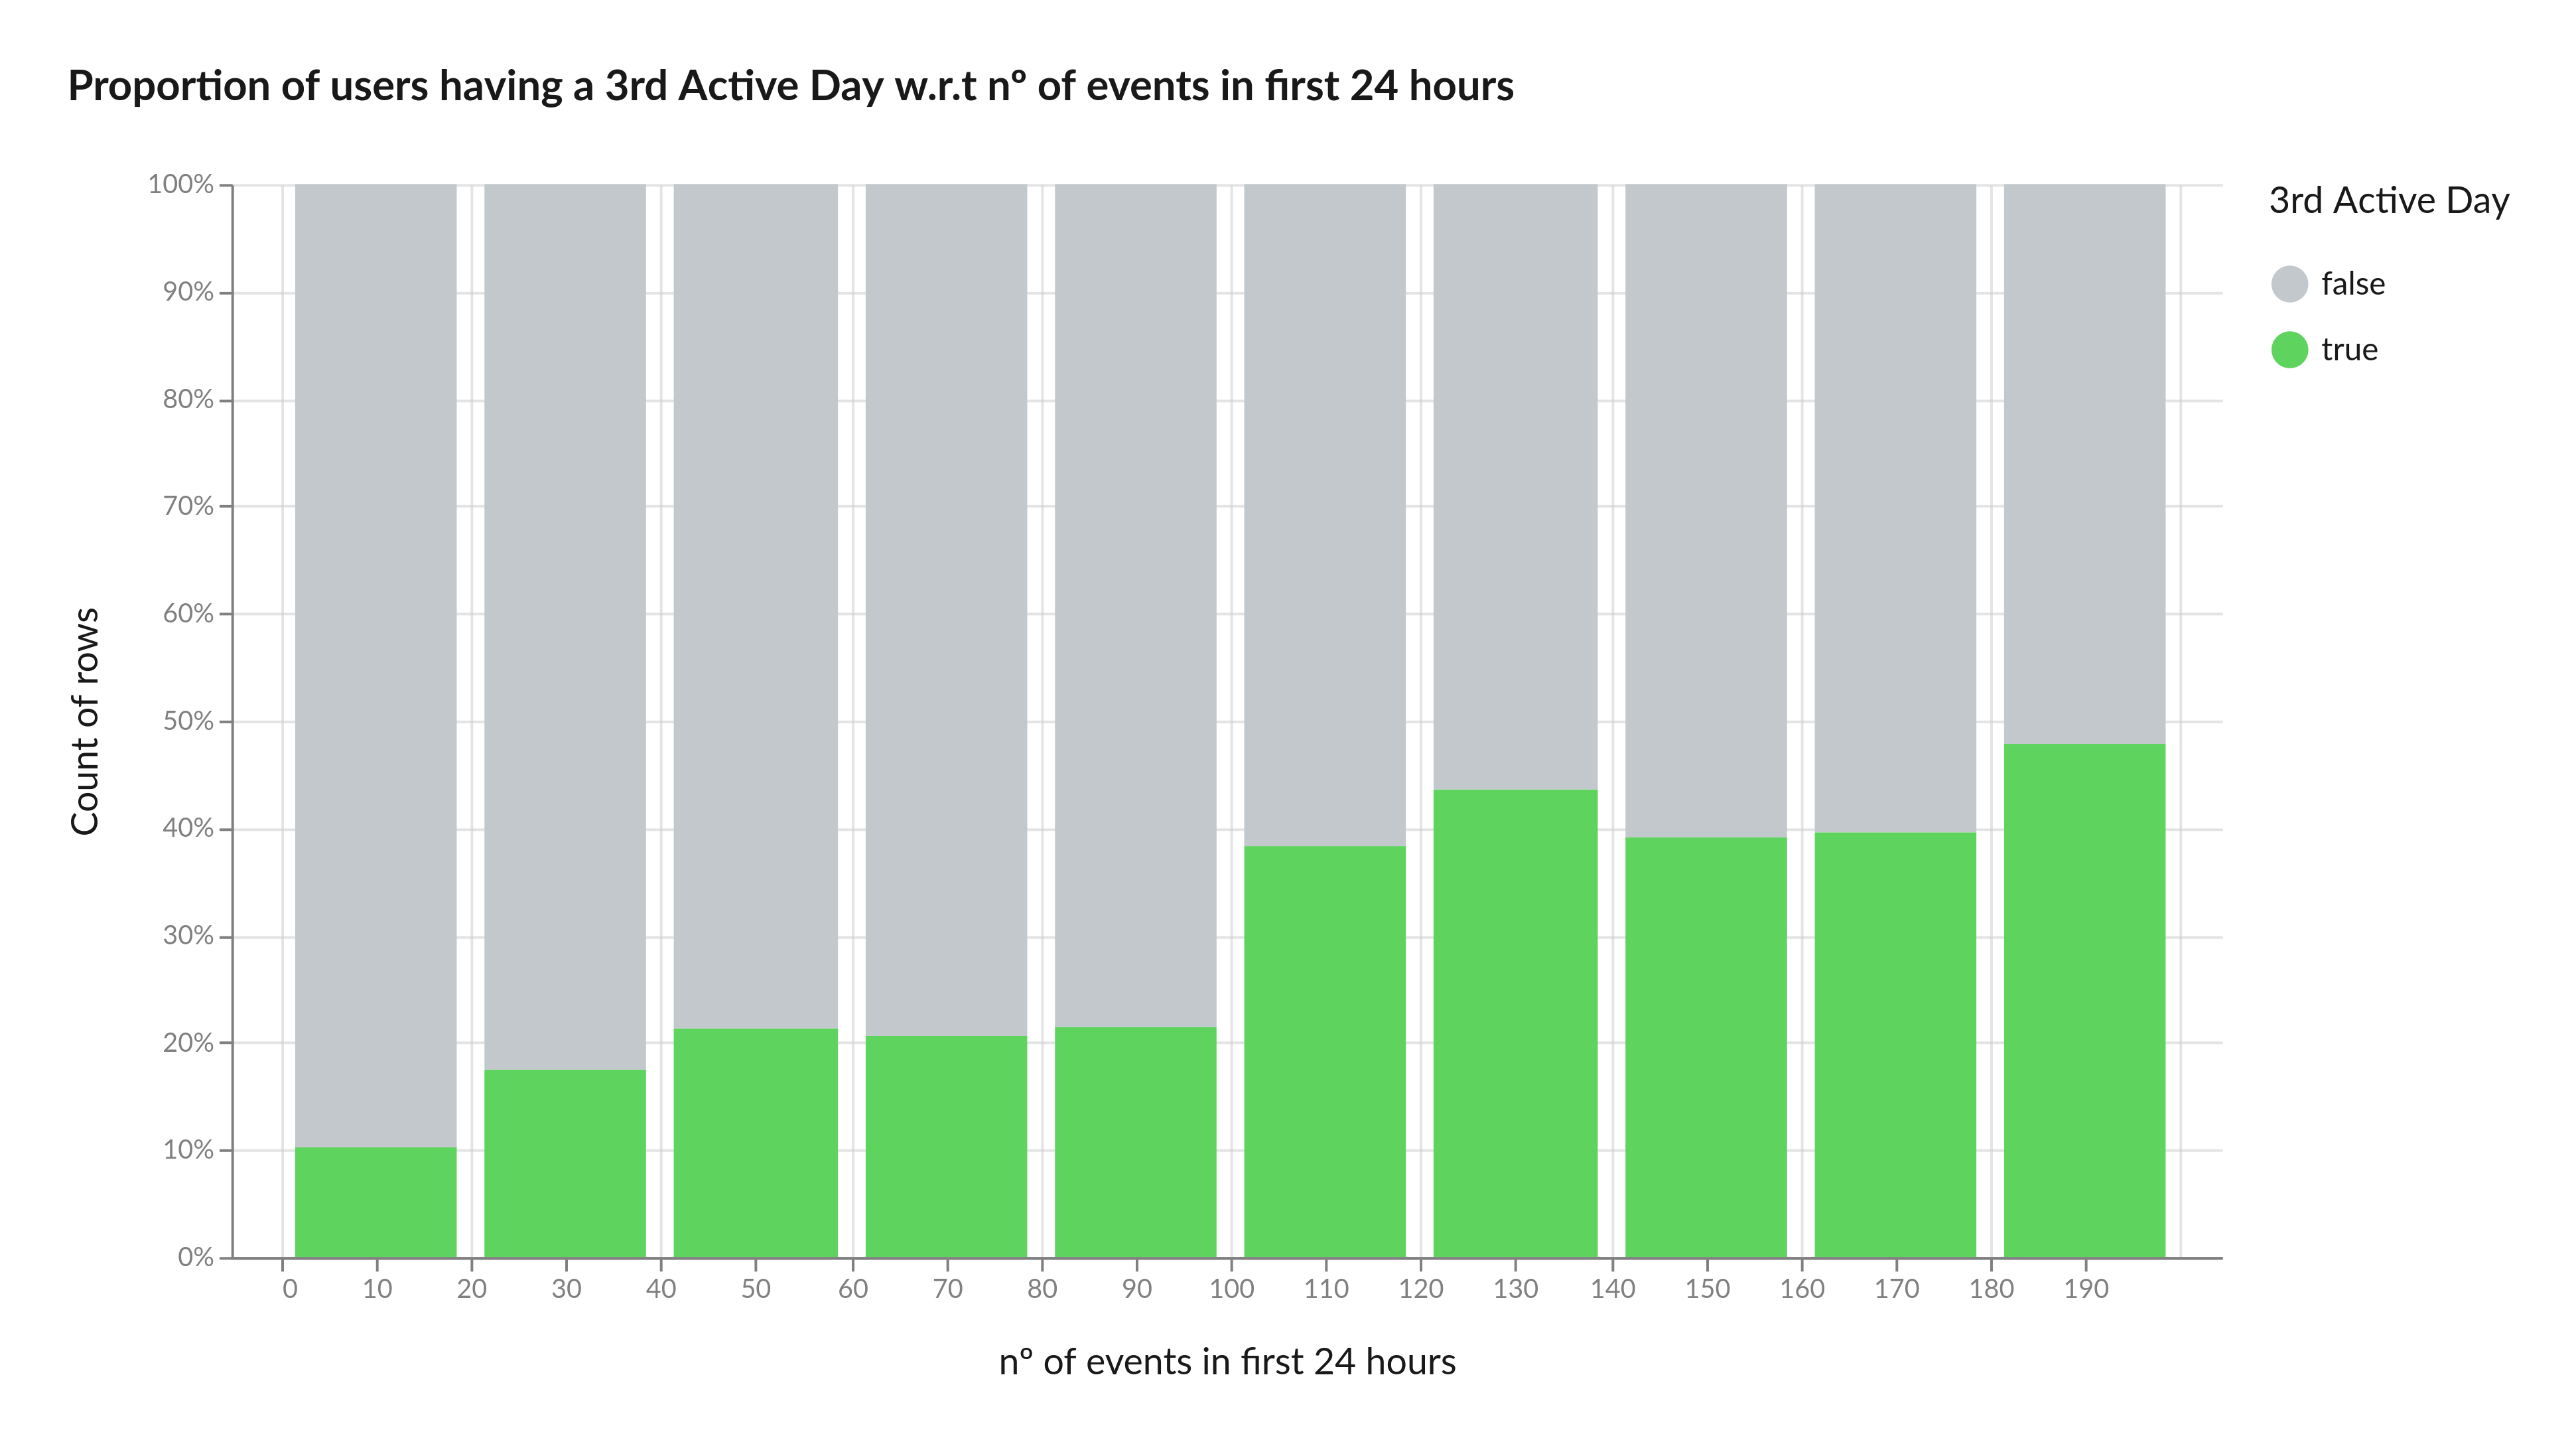
Finally, we discovered a positive correlation between the number of events within the first 24 hours and conversion. The chart below illustrates that users with 100 or more events on the first day have a 40% probability of converting to the 3rd day of activity.
From Insights to Action: Training a Lead Scoring Model
To train our lead scoring model in Graphext, using the identified features, we first create an integration with BigQuery, which is where we store our customer data (we support many other databases, of course, such as Azure and Amazon S3). Importing the data using a database integration allows us to update the dataset and prediction model whenever necessary, either automatically at specified intervals, or manually whenever warranted. Alternatively, data can also be uploaded as CSV, parquet or json files, for example.
Our lead scoring model is then trained by taking full advantage of Graphext’s AutoML solution to automate data preprocessing, model tuning and evaluation. Since our target is 3rd day engagement, the model by default simply predicts a binary response: "True" if users are likely to have a 3rd day of activity and "False" if not. The video below shows how to easily build your own model in Graphext.
But wait… our goal was not primarily to predict whether users will have a 3rd day of activity, but rather to score them quantitatively based on their potential. We’re in luck, however, since in Graphext a trained classification model not only predicts the most likely class, but also the probability of that class. So in order to arrive at a final lead score, we simply use the probability that a user will in fact remain engaged (as the figure below shows, this is simply the predicted probability when the prediction is “true”, and 1 minus the predicted probability when the prediction is “false”).

After training the lead scoring model with historical user data, we predict the lead score for new sign-ups and rank them accordingly. The prediction stage is performed in Graphext at regular intervals and results are written back to our selected database, as described in our documentation.
Unleashing lead score: How to read the numbers
The obtained lead score ranges from 0 to 1, where scores > 0.8 indicate users with high potential of engagement and scores < 0.4 suggest unlikely engagement. Users with scores between 0.5 and 0.8 are of special interest as they represent uncertain but possible engagement. By focusing on this segment, businesses may focus their efforts and potentially convert these users into loyal customers.
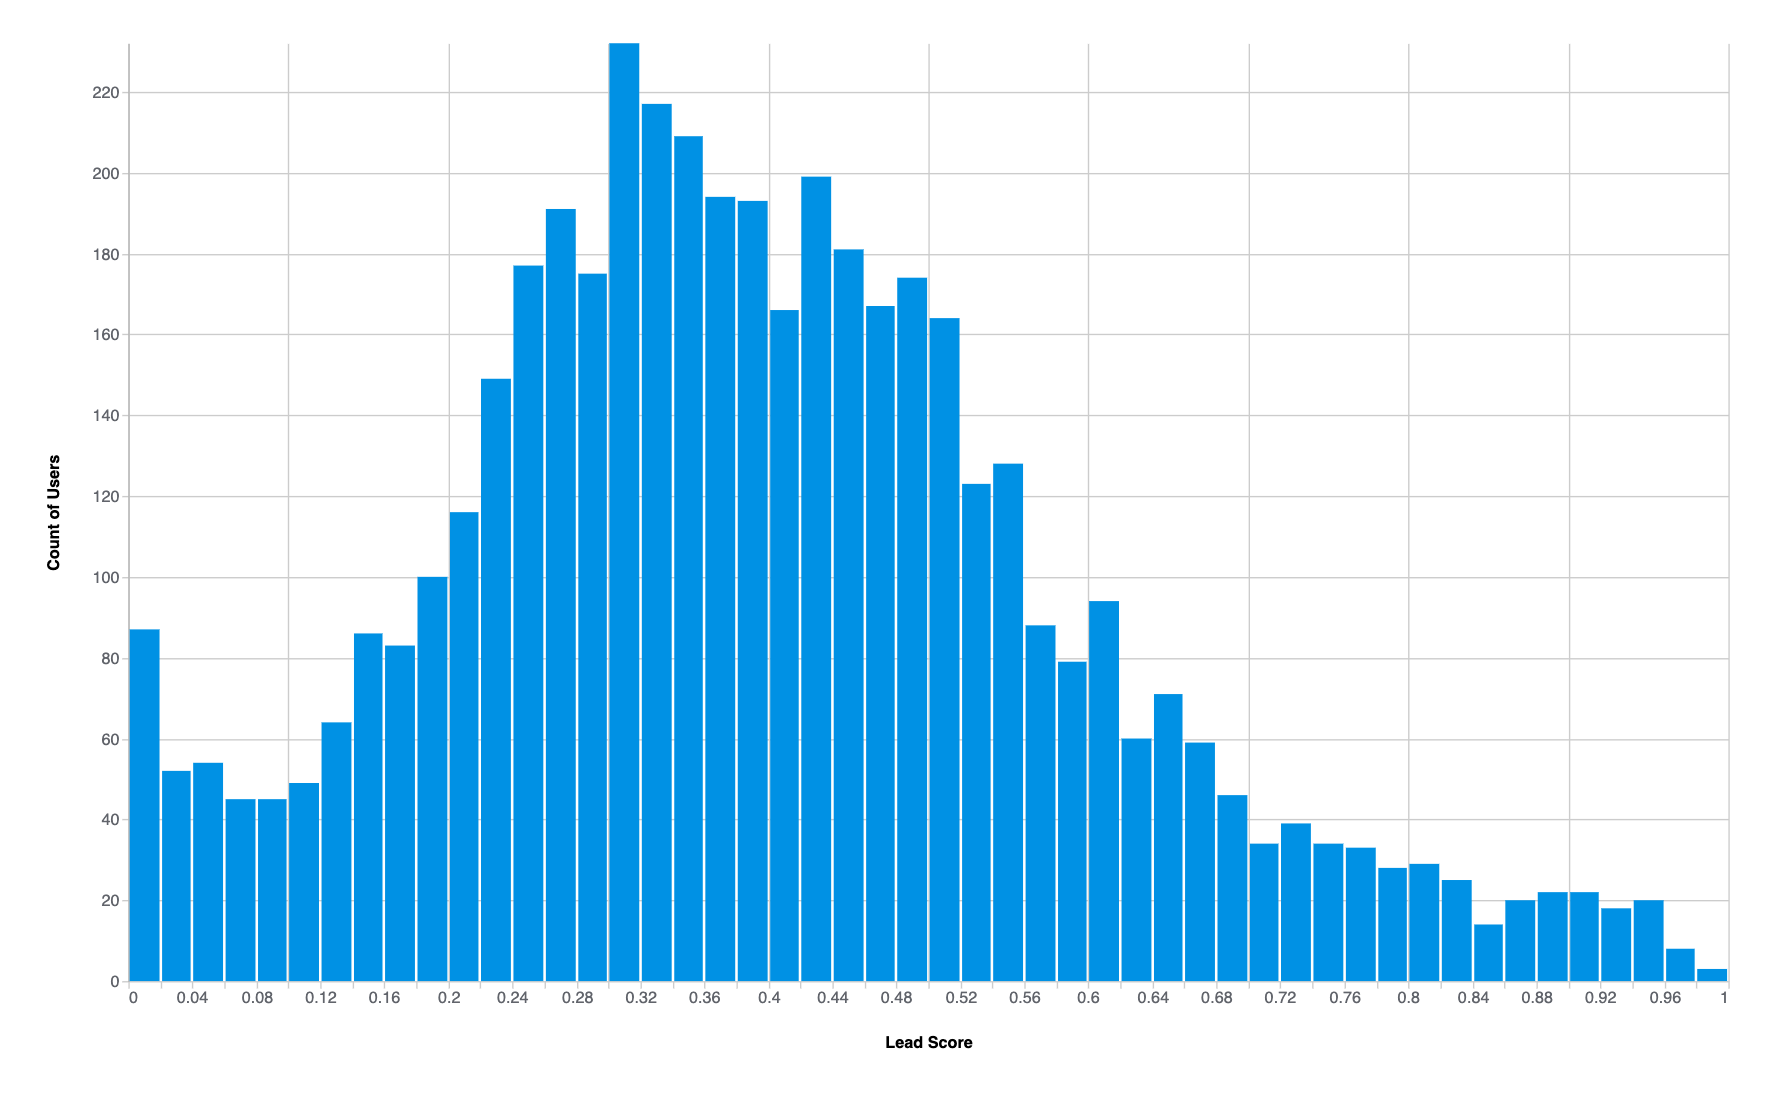
To ensure the quality of our lead score, we discretize and calculate the accuracy for each segment of scores (also known as measuring probability calibration). We found that for scores over 0.8 the accuracy of the mode was above 80%, indicating confidence in engagement for these leads. For users predicted as not engaged with a score lower than 0.4, the model has an accuracy of over 90%, indicating high confidence in this negative prediction. However, for the users with scores ranging from 0.5 to 0.8, the accuracy is lower, meaning uncertainty in the prediction. However, these scores shouldn’t be rejected, as they represent users with similar behaviour and characteristics of users that converted, making them an interesting segment to be targeted by marketing and business.
Given that we integrated our database with Graphext, we are able to easily put our lead scoring model in production. We simply write the calculated score back to our database and send it to Hubspot (our CRM) using a reverse ETL tool such as Weld, thus making it accessible for our business team.
The lead score model can now be used to optimize business efforts. For example, the business team can focus on high-scoring leads to prioritize contacting users with higher chances of conversion, thereby saving time and resources. Additionally, targeted campaigns may be designed to engage the leads with scores between 0.5 and 0.8, for example, who represent an uncertain but potentially valuable segment of users.
It's important to note that the goal of the lead scoring model can vary depending on the selected target. In our case study, the target was engagement, but the model could be trained for other targets such as selling, recommendation, or even customer lifetime value. By understanding the specific goals of the model, businesses can tailor their marketing strategies and make data-driven decisions that lead to growth and success.