
Menhir & Graphext- Analyzing the Intangible Value of Financial Assets.
Menhir are building an algorithm to understand the value of a financial asset. To help them conduct exploratory data analysis on a portfolio of assets, they use Graphext to cluster financial datasets. We spoke to Fran, CEO at Menhir, to understand more about the way they use Graphext to access immediate insights about the features and value of assets in a financial portfolio and why this saves them so much time.
Lending money is a tricky business, and it gets trickier if the borrower does not repay the debt. The value of a loan depends on its characteristics, which are often tangled in ambiguous and volatile networks. In financial enterprises, untangling the value of assets and deciding on what action to take is a task of gargantuan importance. We are all familiar with the image of the old stockbroker with a clenched fist, purple face and pulsing veins. For portfolio managers keeping track of hundreds of assets and at the same time understanding the intricacies of each asset is practically impossible. Still, this is a space where details matter.
Keeping track of hundreds of assets and at the same time understanding the intricacies of each asset is practically impossible.
The application of data science techniques in fin-tech enterprises is making life easier for portfolio managers. Advances are being made quickly in the development of AI technology that can model portfolios in order to direct people to make more informed decisions. This is the realm of companies like Menhir, where investment experts and data scientists meet at the intersection of artificial intelligence and finance.
The team behind Menhir.
Menhir is building an algorithm that understands the value of assets. Founded in January 2020 by Francisco Hernández, Menhir's models process the features of an asset in order to analyze its intangible value, which boils down to the probability of getting the loan repaid or not. Their technology models a portfolio, crucially distinguishing the non-performing loans (NPLs) that are more likely to be collected from the NPLs which have an expected value of 0€.
"We use Graphext to understand the composition of a portfolio and verify that the input data we are feeding our AI Algorithms with is correct and clean."
This way Menhir can uncover the nature of asset sub-communities and pass this information onto banks and funds who then use these insights to understand how and when to collect assets. To help them accomplish this, they use Graphext as the first step towards their fully automated asset management model.
Fran and his team have been using Graphext to dissect the composition of financial portfolios for 5 months. Typically, they employ the platform to clean and process their data before applying a machine learning model to discover the communities of assets inside the portfolio and investigate the features of these communities.
Menhir performed an analysis that usually takes analysts around two to three weeks in just two days.
Discovering Valuable Financial Assets
In a recent project that Fran shared with us, Menhir was working with a dataset of 8229 defaulted consumer loans belonging to a single portfolio. They were investigating the frequency of monthly payments with the intention of highlighting the most productive community of the portfolio's assets for their client to target. Specifically, they wanted to expose groups of inactive assets as well as highly active ones and use Graphext's model to recognise which characteristics were most correlated with these groups.
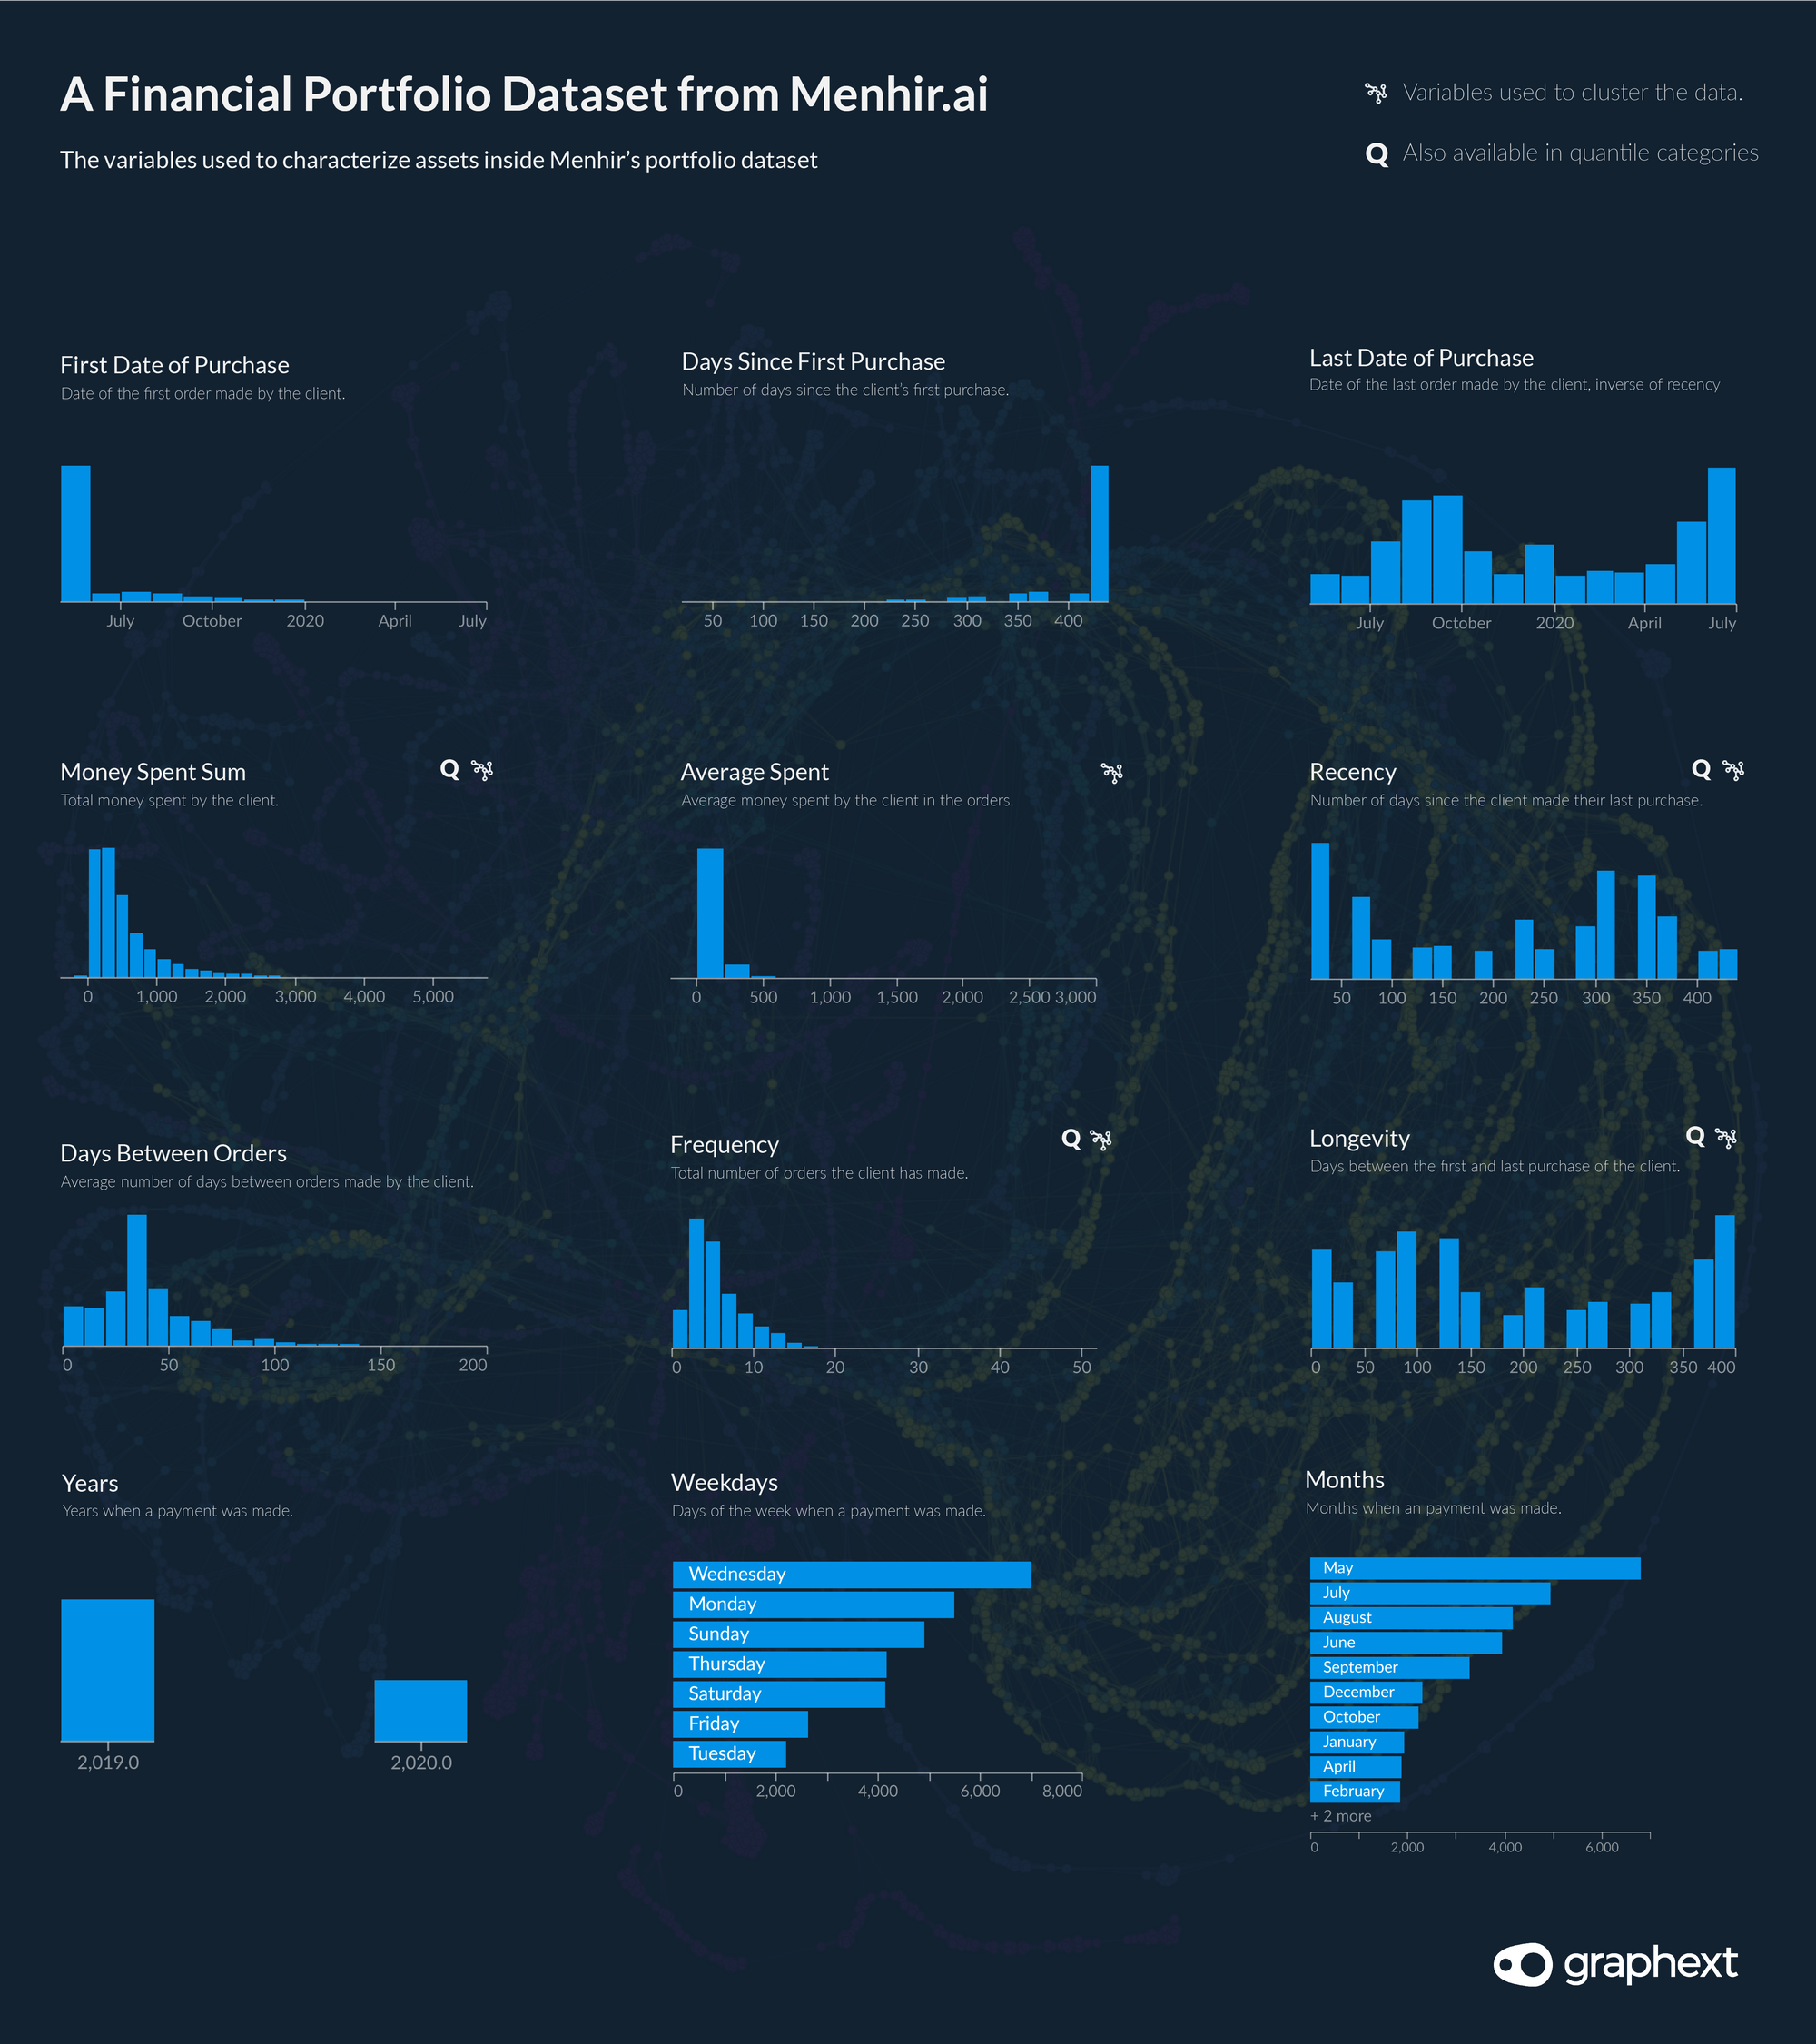
Variable charts: Menhir's financial portfolio dataset.
Fran and his team clustered loans in the portfolio using a flow similar to RFM analysis, which is typically used to categorize customers according to the recency of their last purchase, the frequency of their payments and the money they spent. On top of the recency, frequency and money spent variables, their project also factored in the longevity of an asset or the days between their first and most recent payments.
"We wanted to understand which are the more frequent payers, the people that never pay a dime and the ones that are in the middle. Why? Because you want to create different management strategies with all these different consumer types."
A Network of Financial Assets
When creating network visualizations, Graphext uses the variables set as factors to cluster rows in a dataset. Communities of similar data points are therefore grouped together into clusters, which in itself becomes a variable that you can use to explore the project. In Menhir's project, this meant that the clusters displayed in the Graph could be used to observe how each customer is placed near others with the same behaviour, forming a clear representation of the communities of assets with similar characteristics.
However, there is more on offer inside a Graph than merely focusing on the automatically generated clusters. Selecting elements inside of the network as well as filtering using the sidebar charts makes it possible to explore communities in flexible ways, identifying the segments you really care about. This is what Menhir did.
Fran and his team segmented the portfolio in order to group assets according to the frequency and amount of their recurring payments.
Fran and his team segmented the portfolio in order to group assets according to the frequency and amount of their recurring payments. He told us that an important part of managing portfolios was to identify specific and relevant action to take with sub-communities of assets that behave in distinct ways. This is difficult for portfolio managers to do when they have hundreds of assets to handle. Filtering inside of the Graph, Menhir quickly identified the group of assets with the highest frequency and amount paid, and could then begin studying their characteristics in order to plan specific recovery actions.
"We found out that 20% of the portfolio was responsible for 43% of the payments. Generally, these were older people. What's more, we identified that for this particular portfolio, people in Barcelona were paying better than people in Madrid."
Frequency, Recency and Money Spent
They did this using two of our platform's features. First, when Menhir built the project, Graphext automatically calculated quantiles for frequency, recency and money spent, making it easy for Fran to identify and target the assets belonging to a high RFM range. Then, he and his team could use these quantiles to filter the Graph. This instantly updates all of the other variable charts inside of the project to show the characteristics of assets inside of their selection. In this way, they could browse through the variable charts to recognize the characteristics of each community.
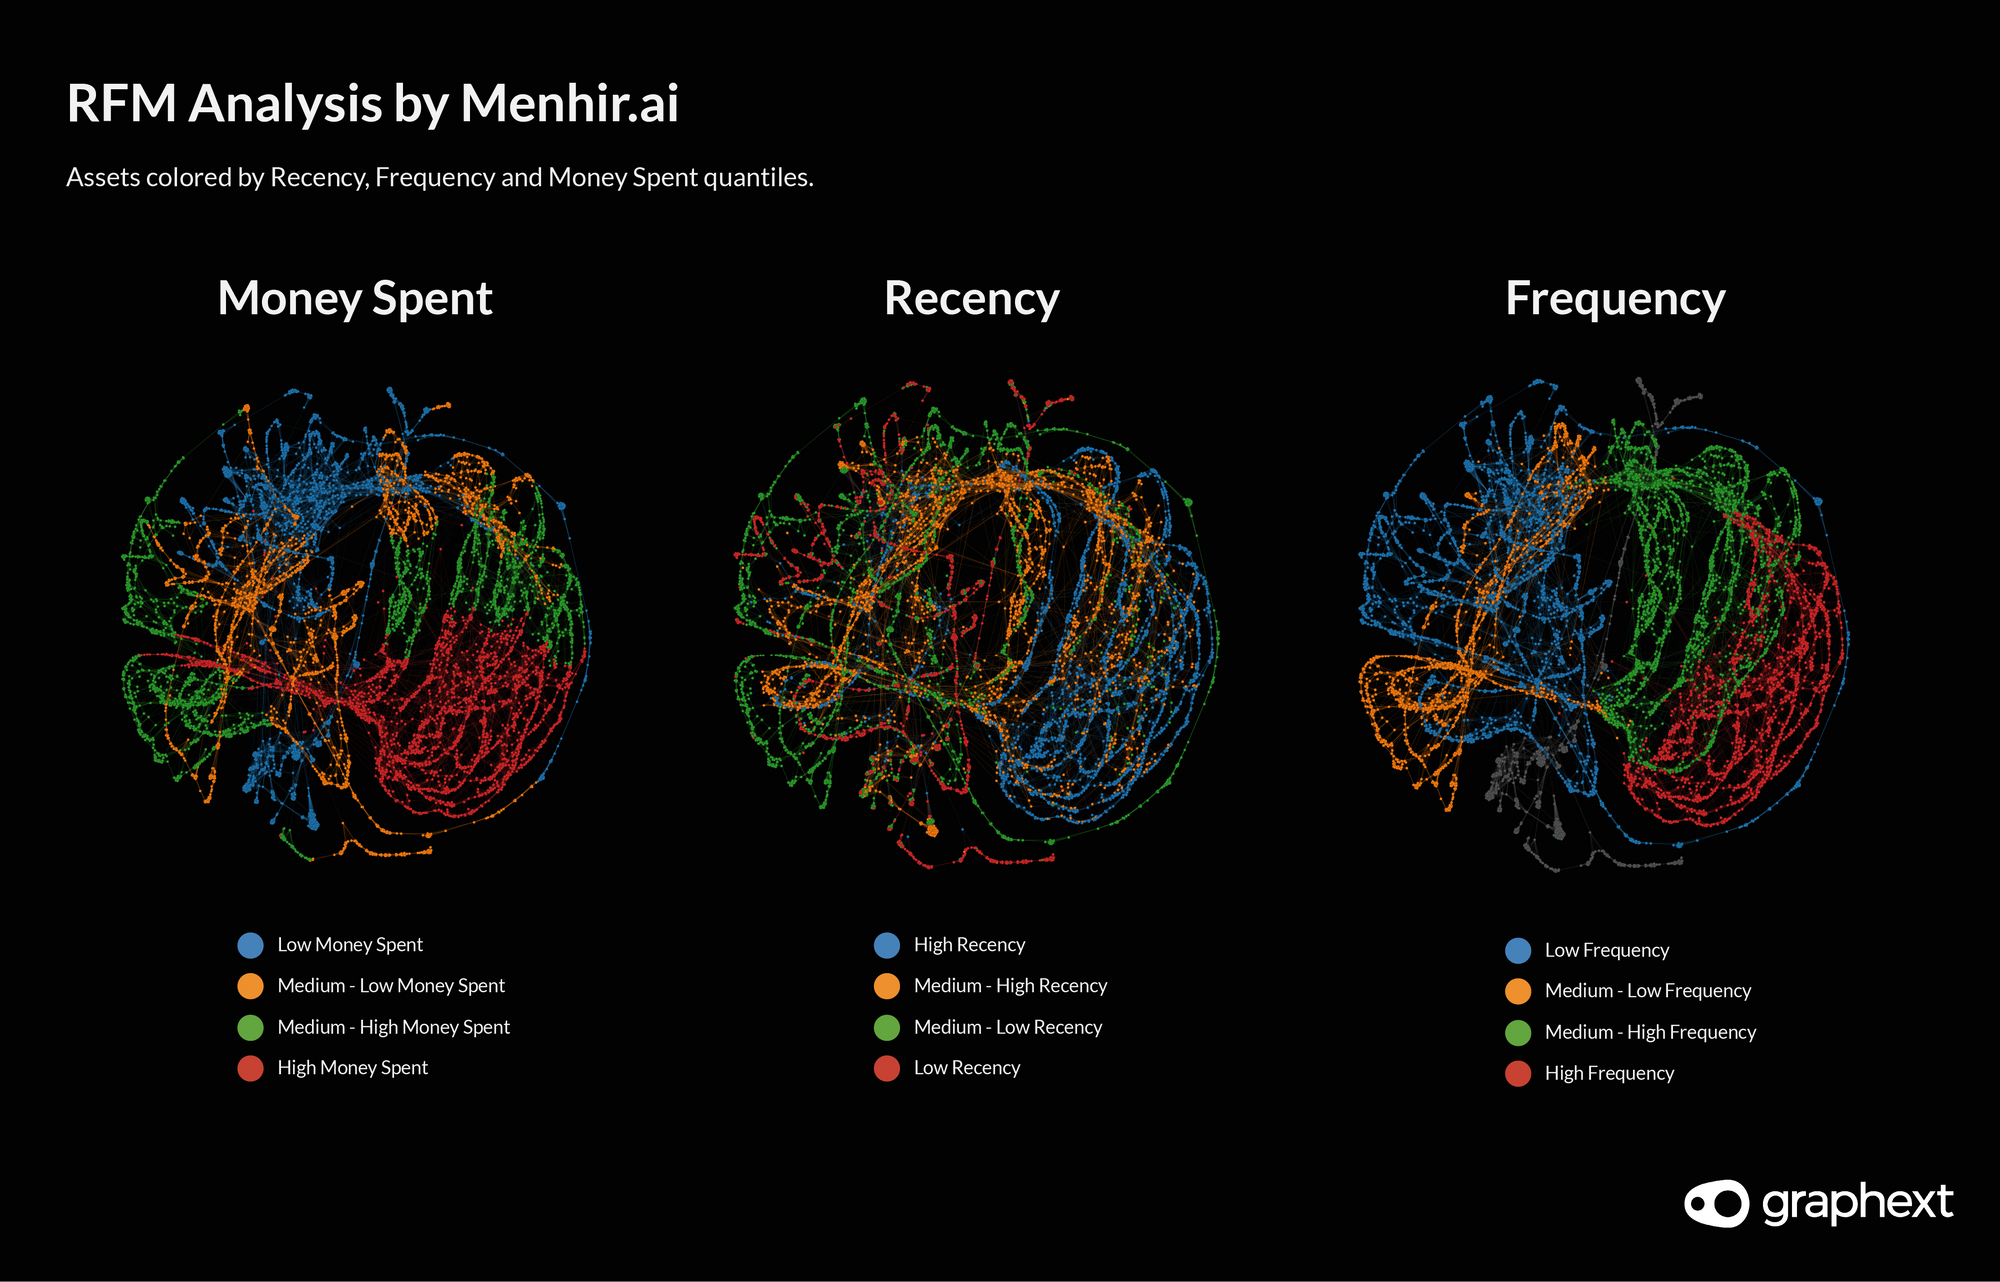
Graph: Assets colored by recency, frequency and money spent.
Next, Fran and his team began to investigate the relationship between the frequency quantiles and days since last payment, birth Date, and zip code variables. The differences between high and low payment frequency assets became immediately visible when they started filtering to isolate assets within these groups. The older age of assets that were frequent payers was in stark contrast to the younger ages of those in the less frequently paying community. Specifically, people who were born between 1940 and 1970 tend to pay significantly more frequently than those born after 1975.
Frequent vs Infrequent Contributors
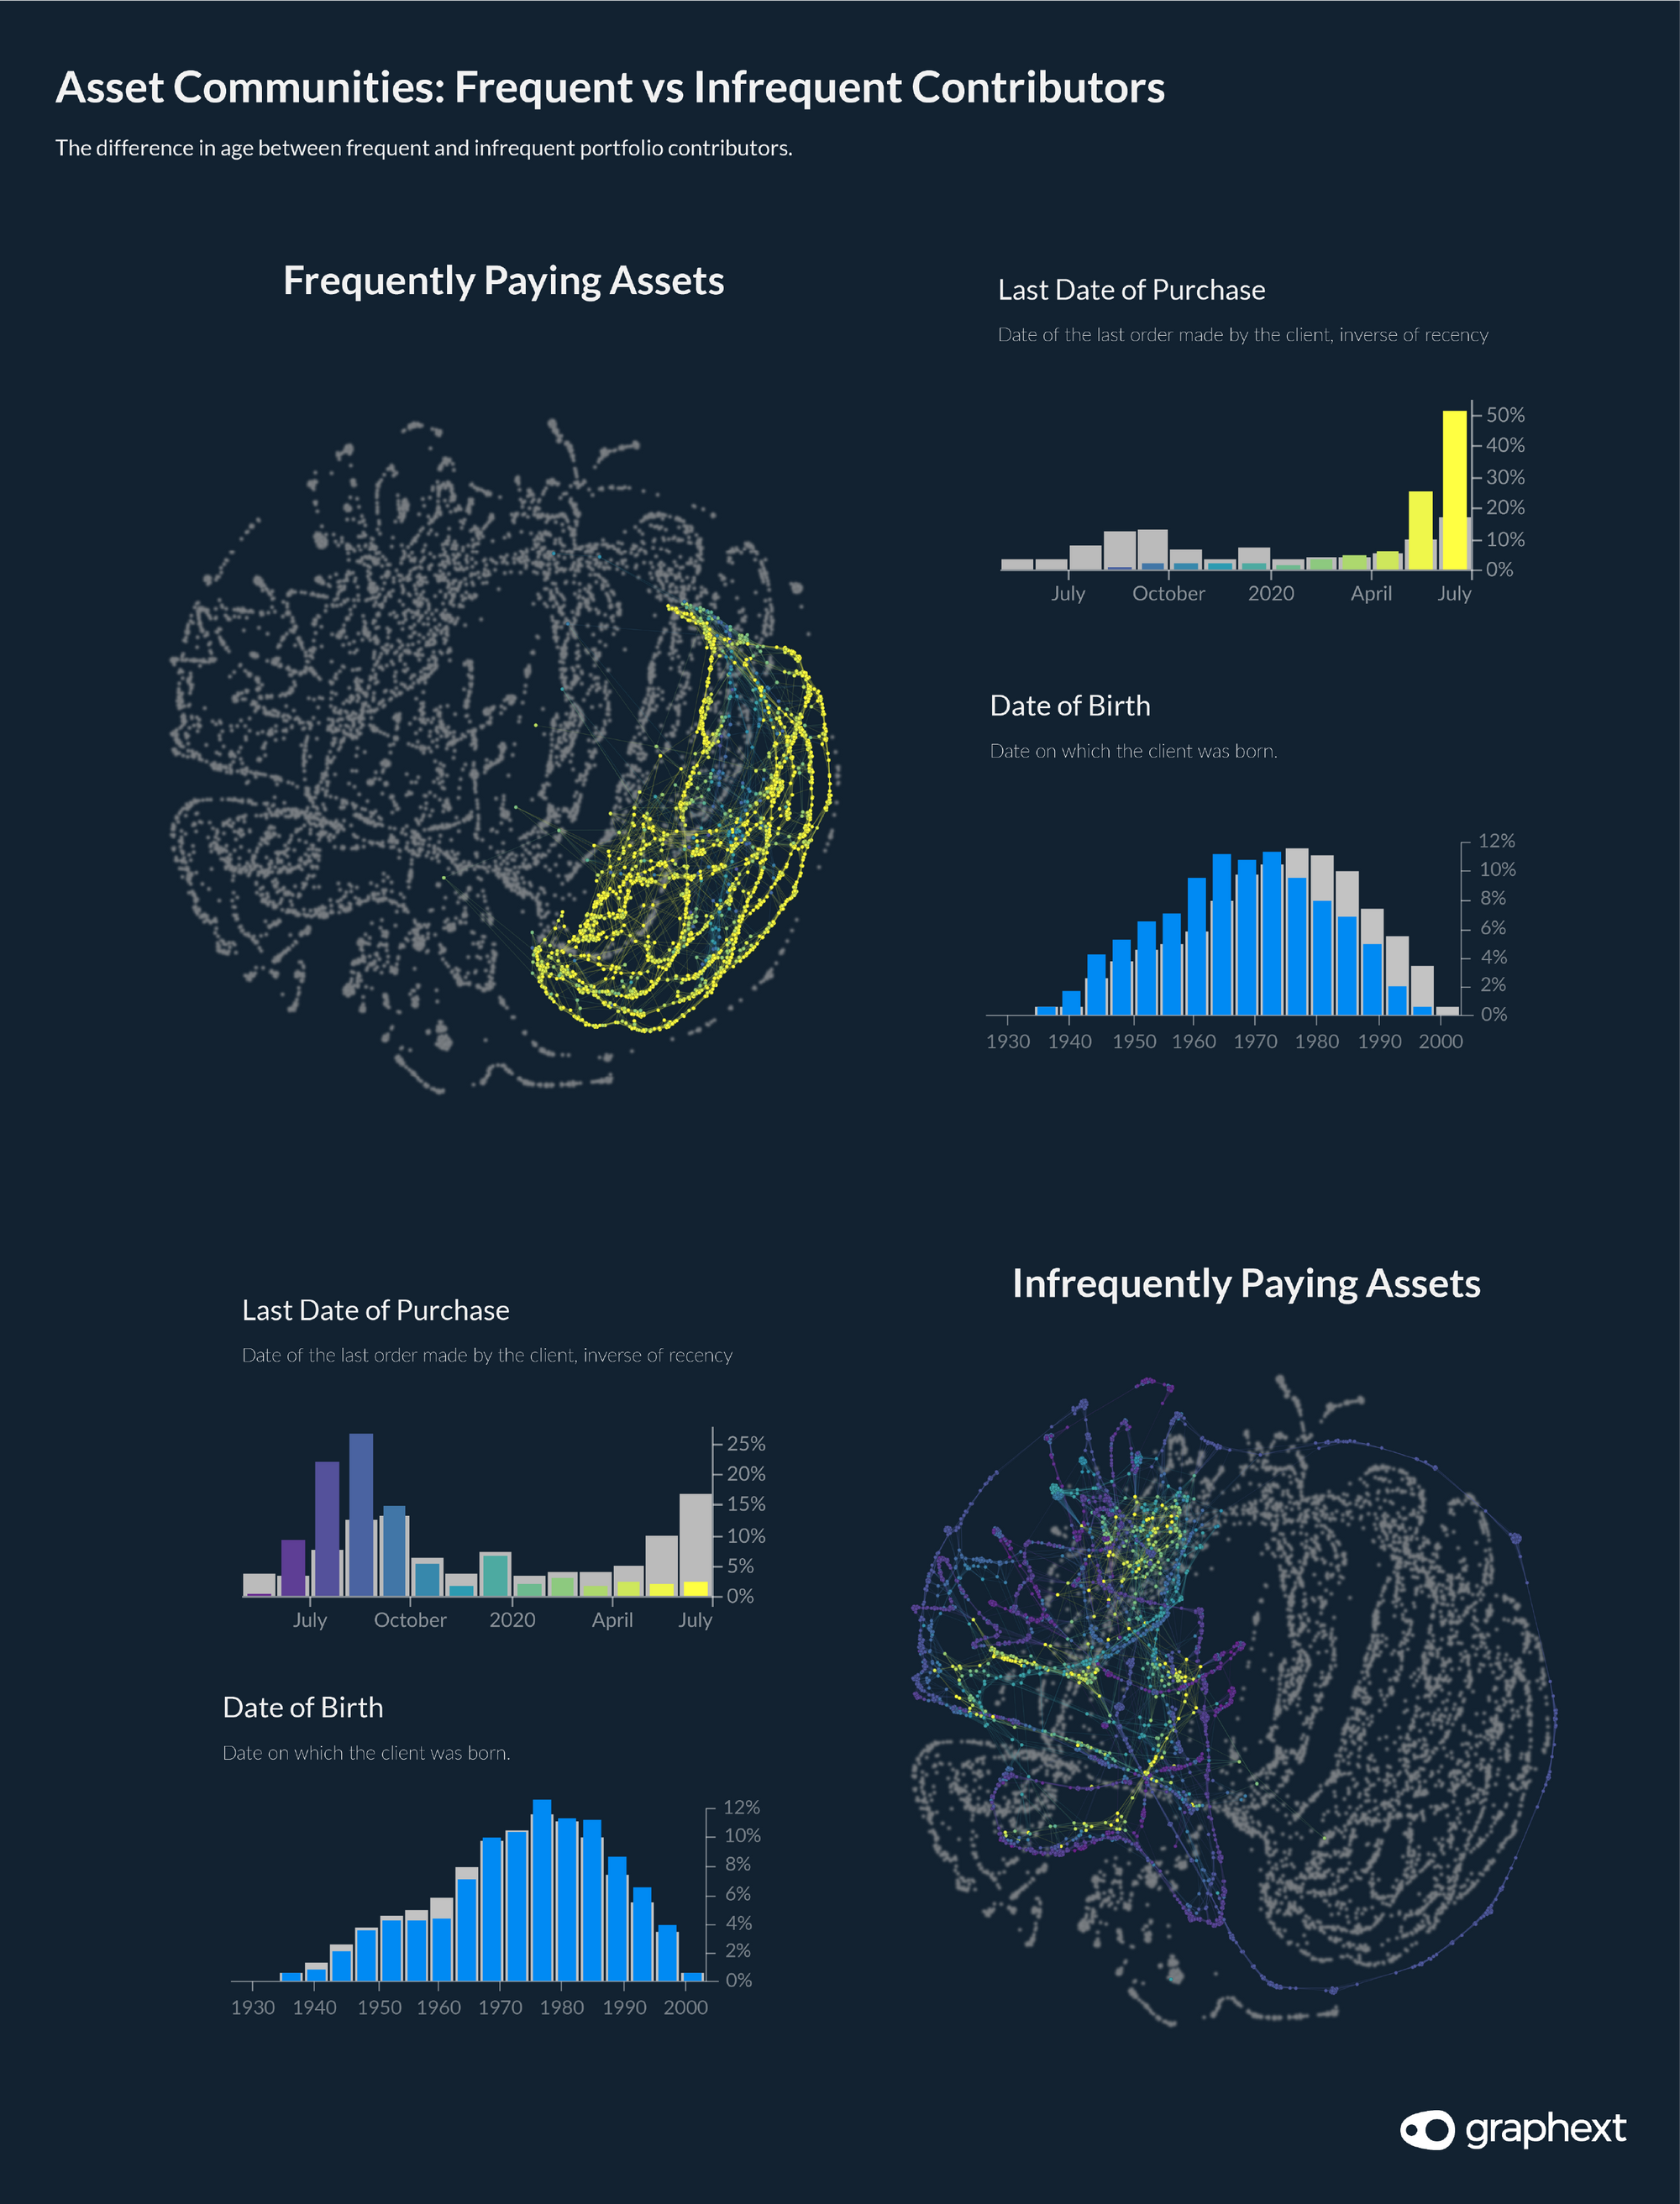
Graph: Menhir's communities of assets.
Moreover, the difference between these groups was further emphasized by the geography of assets. Comparing the distribution of zip codes between frequently and infrequently paying assets showed Menhir, in contradiction to popular belief in Spain, that people from Barcelona are paying more than people from Madrid.
"We could design hyper-targeted strategies depending on the cluster of the client."
The numbers were clear. People with high payment frequency occupied 20% of the portfolio but represented 43% of the payments. Meanwhile, low-frequency assets made up 30% of the portfolio and only represented 16% of payments.
Thanks to Graphext, Menhir was able to tackle the due diligence of an unknown portfolio, understand the different clusters, design a business plan and build a collection strategy for each segment of loans.
Fran told us that the kind of analysis that his team performed here usually takes analysts from two to three weeks. With Graphext they were able to draw conclusions in just two days, with an outcome so precise that was used to pitch the portfolio to Limited Partners.
Today, Menhir use Graphext to understand how their artificial intelligence models can sort portfolios between different asset managers and to understand the compositions of portfolios. This helps Fran and his team identify outliers and recognise loans that should be placed in other distribution channels in order to get them resolved as fast as possible.