

A Market Segmentation of 1000 Supermarket Customers Using Data on Sales, Income and Demographics
We segmented 1000 supermarket customers in order to pick out key personas using data on their income, demographics and geography. This type of market segmentation can be used to inform marketing efforts, direct campaigns or identify potential customers. Here's how we did it ...
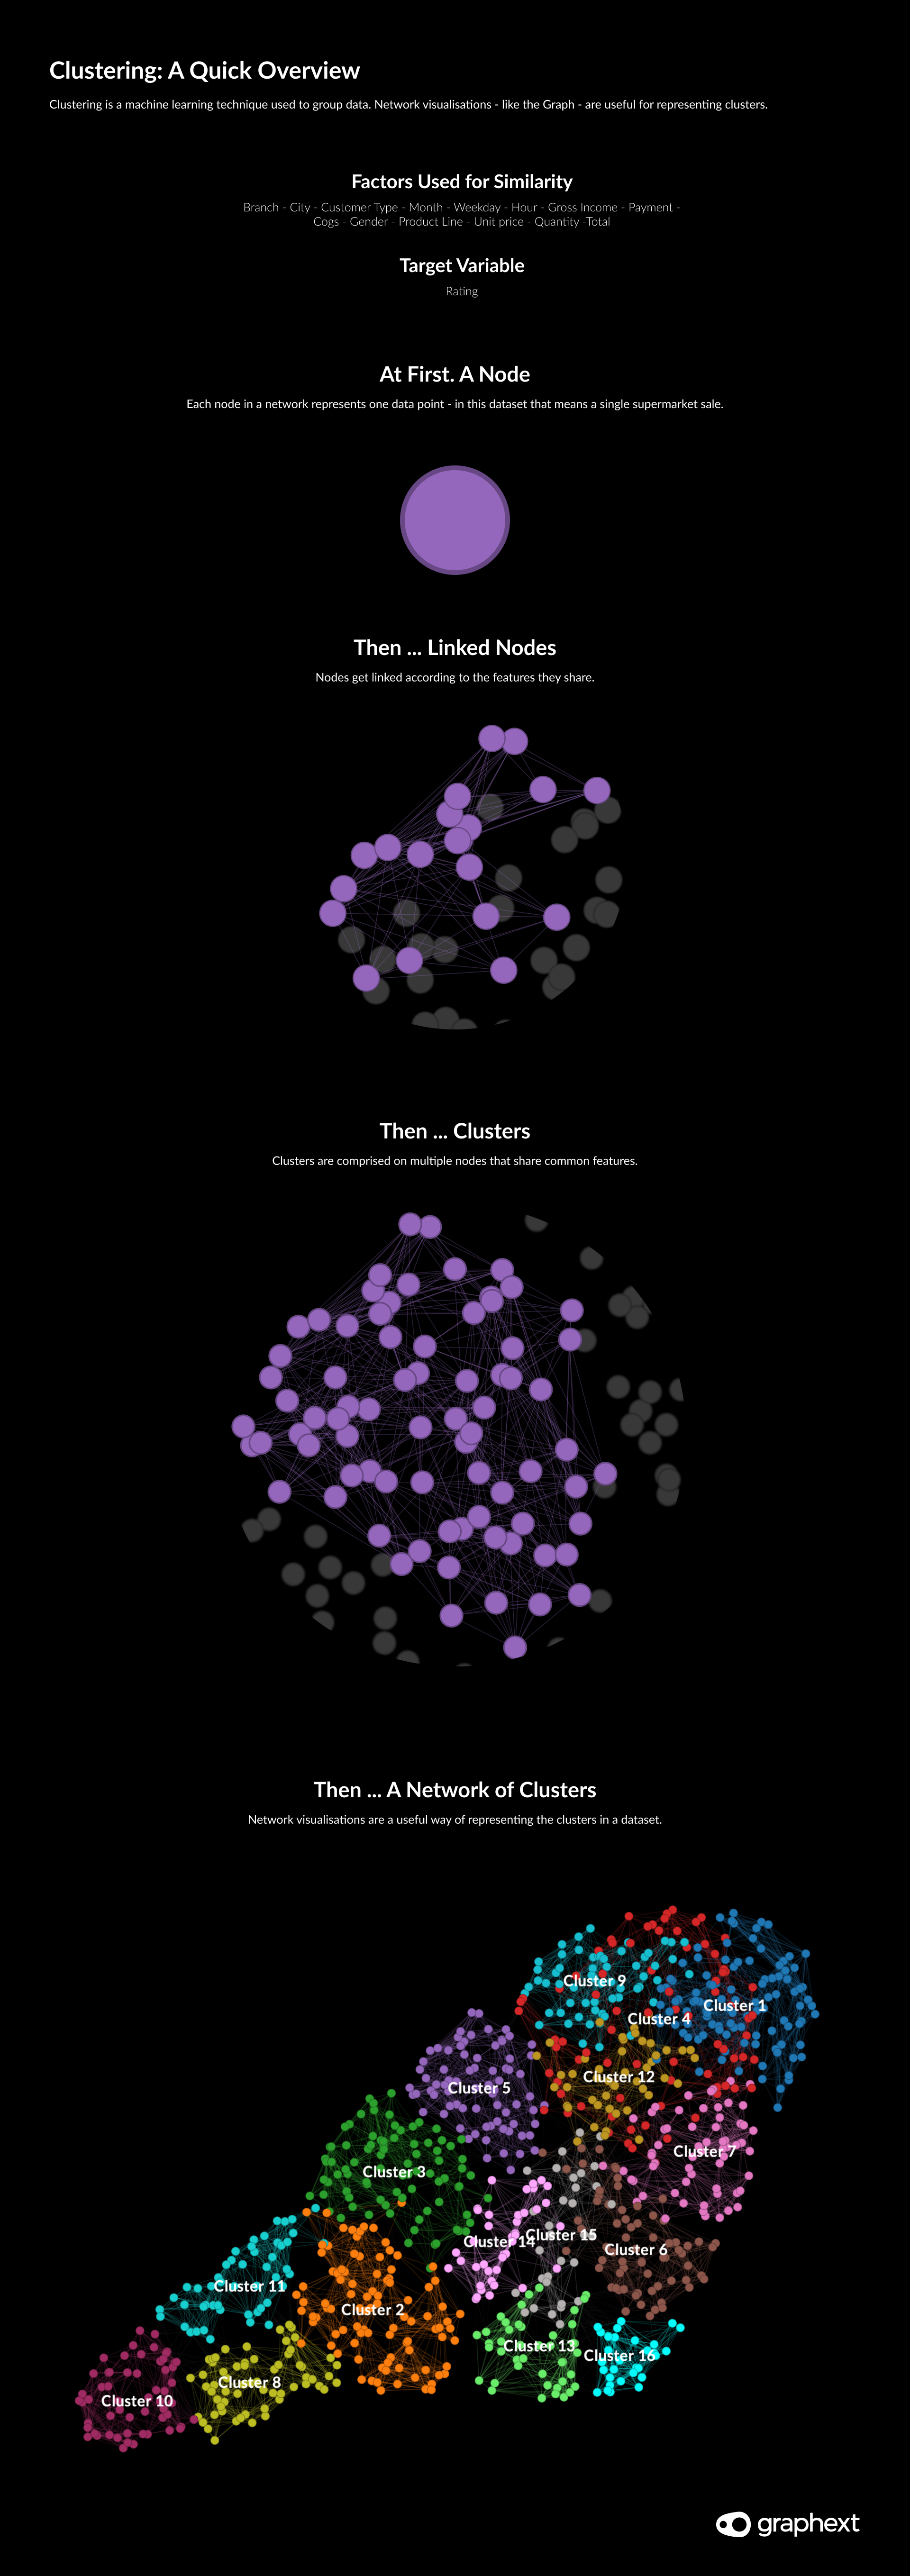
One of the most popular analysis types in Graphext involves clustering a dataset - something extremely useful for businesses looking to segment their market or customer base. Simply put, clustering helps to expose similarities between your data points. Less simply put, clustering is a machine learning technique used to group data so that rows in the same group - or cluster - share more features with each other than with those in other clusters.
Networks - like the Graph - are perfect for representing clustering analysis. Network visualisations pull data points towards one another according to their connections. In theory, the kind of gravity at play here means that nodes that are more similar are positioned closer to one another and can be grouped into clusters.
Each node in our network represents a single supermarket sale.
Network visualizations like the Graph are perfect for representing clustering analysis.
Note: Depending on the type clustering algorithm your Graphext project uses - the way that networks are created can vary. For instance, a UMAP algorithm will position nodes on the network before creating links. For a technical perspective on creating networks - see our article on Depending on the type clustering algorithm your Graphext project uses - the way that networks are created can vary. For instance, a UMAP algorithm will position nodes on the network before creating links. For a technical perspective on creating networks - see our article on Creating Graphs and Layouts.Creating Graphs and Layouts.
Because clustering has the ability to segment audiences, customers or text - it has applications across the spectrum of data science including market research, pattern recognition and image processing.
Here, we're focusing on supermarket sales. Specifically, our team set out to segment customers of a large store based on their demographics, buying preferences and income metrics as well as data on their geography and the products and services they purchased. Our aim was to find the characteristics that linked customers to one another, to expose patterns in their buying preferences and to demonstrate how clustering can be used to direct specific business decisions - for companies of all shapes and sizes.
Our aim was to find the characteristics that linked customers to one another, to expose patterns in their buying preferences and to demonstrate how clustering can be used to direct specific business decisions.
Supermarket Customers: What's in the Data?
The dataset records 1000 supermarket sales in Myanmar across 3 branches and over a period of 3 months and offers a perfect opportunity for demonstrating how to conduct market segmentation analysis. We set 13 variables as factors that would be used to calculate the similarity between sales and serve as the basis for establishing our clusters. Then we set Rating as our target - a score out of ten representing the customer's overall experience - in the hope of gaining a deeper understanding of how each of our factors affected these rating scores.
13 Factors
Branch - City - Customer Type - Month - Weekday - Hour - Gross Income - Payment - Cogs - Gender - Product Line - Unit price - Quantity -Total
1 Target
Rating
To build the project - we used Models - Cluster as our analysis type. For other types of market segmentation analysis - try building an RFM (recency, frequency, money spent) project in Graphext.
Here's a bank of resources to help you start segmenting customers using Graphext.
Segmenting the Market: At a Glance
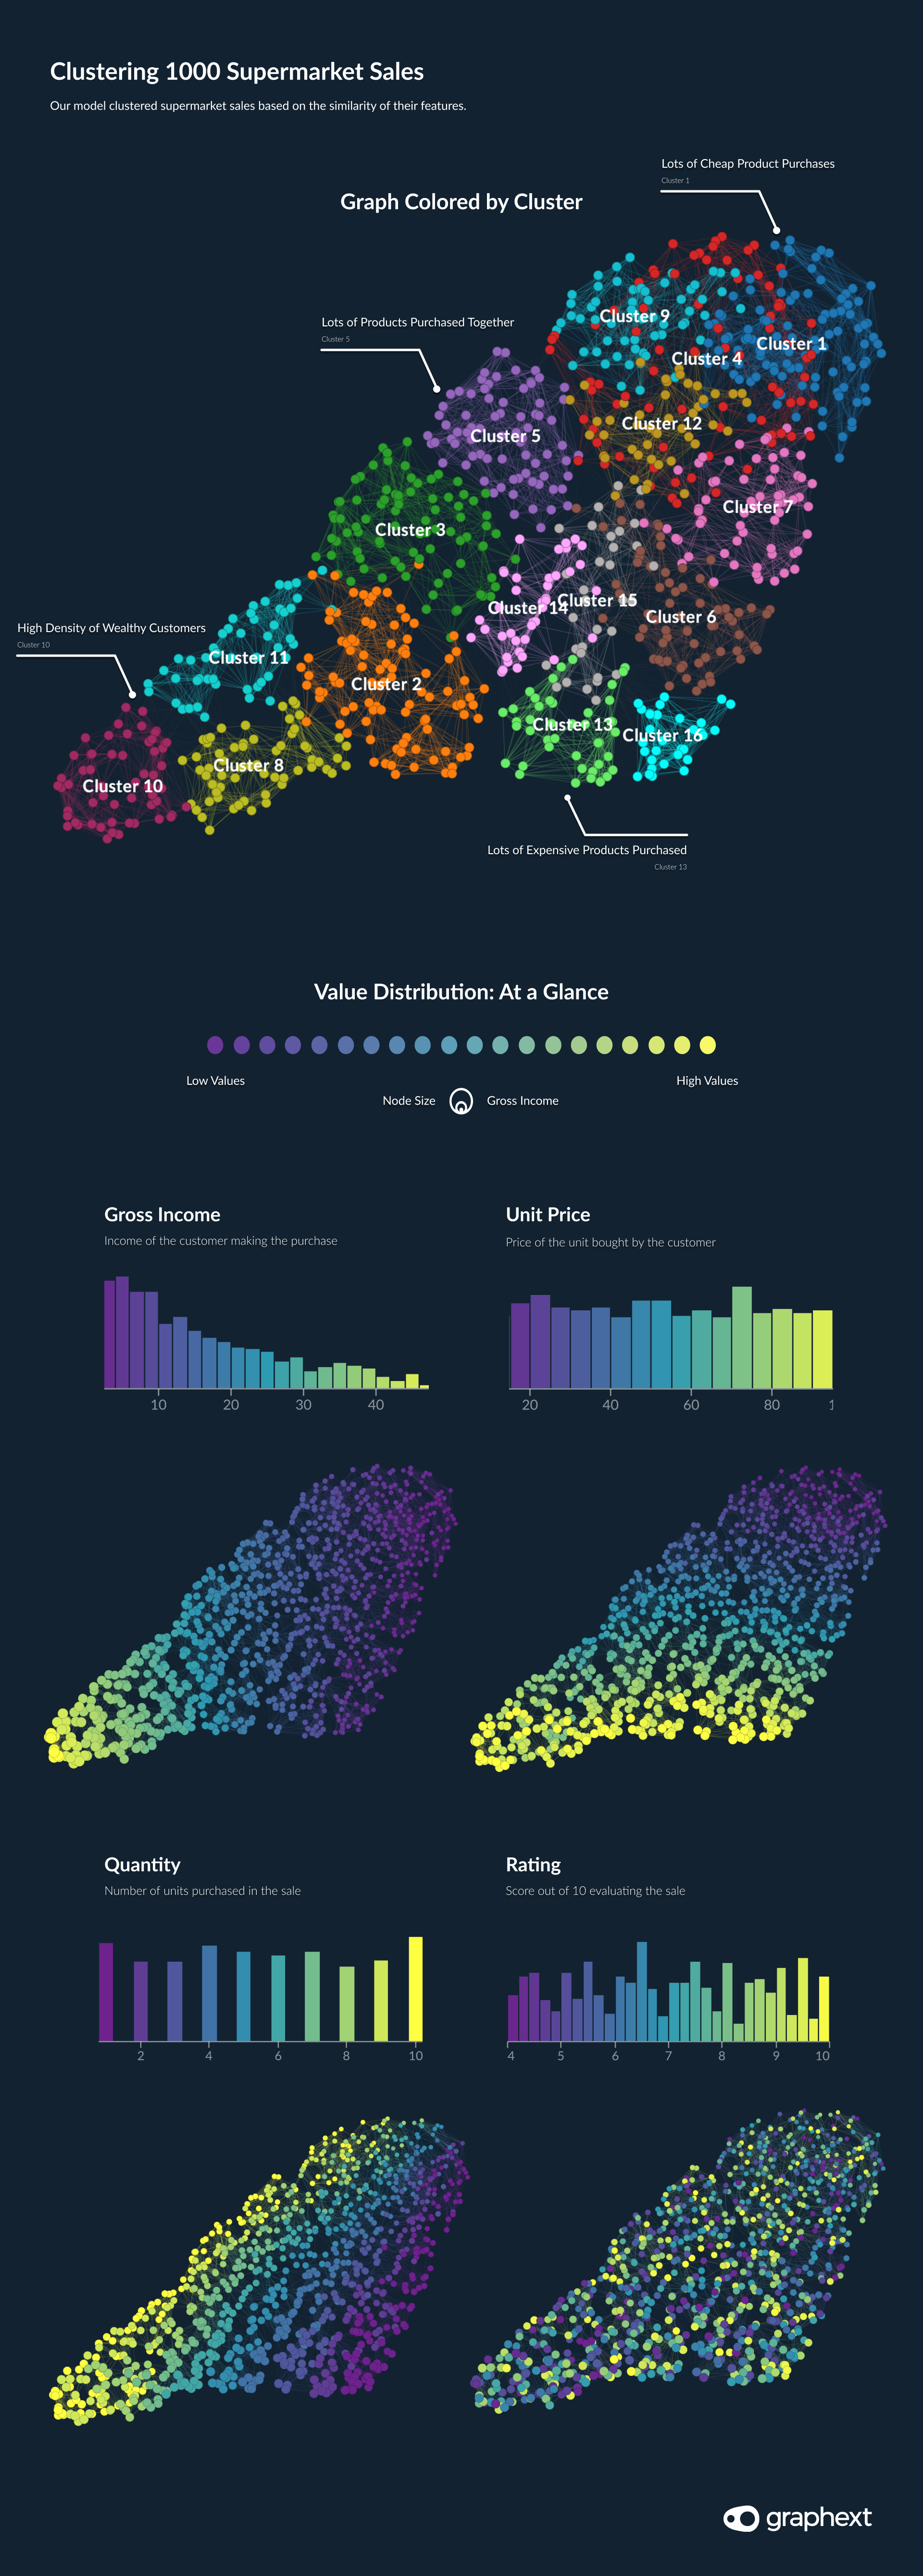
Observing the ins and outs of the buyer personas represented in the data using color mapping inside of our Graph, we could see that the gross income of a customer, the money they spent and the price of units they bought had a significant impact on the customer associations.
Customers with higher incomes were grouped together on the Graph's left perimeter and sales with more units sold were also grouped here as well as the top of the network. This signified that the features of our clusters were well defined. Immediately, the team were able to get a strong sense of the different customer bases occupying clusters in this market segmentation analysis.
Comparing Clusters of Associated Customers
Inspecting the distribution of values across our clusters of customers, we identified five to study further; 1 - 2 - 4 - 10 - 16. To keep things simple, we started out with two clusters - 1 & 2 - our two biggest customer bases and positioned far away from one another. Opening up the Compare panel, we generated charts presenting variables best explaining the difference between customers in cluster 1 and customers in cluster 2.
Inside the Compare panel, Graphext generates a series of charts showing variables in order of their relevance to explaining the difference between our two clusters. Using these, we quickly identified that the most differentiating factors here were money spent - unit price - rating - city. These were the customer characteristics most influential when defining the market segments in this dataset.
Using Compare, we generated charts best explaining the difference between cluster 1 and cluster 2.
Picking out the defining features of cluster 2 with Compare, we were able to clearly see that the majority of shoppers in cluster 2 were shopping in Mandalay, spent a medium amount of money on items with a high price tag.
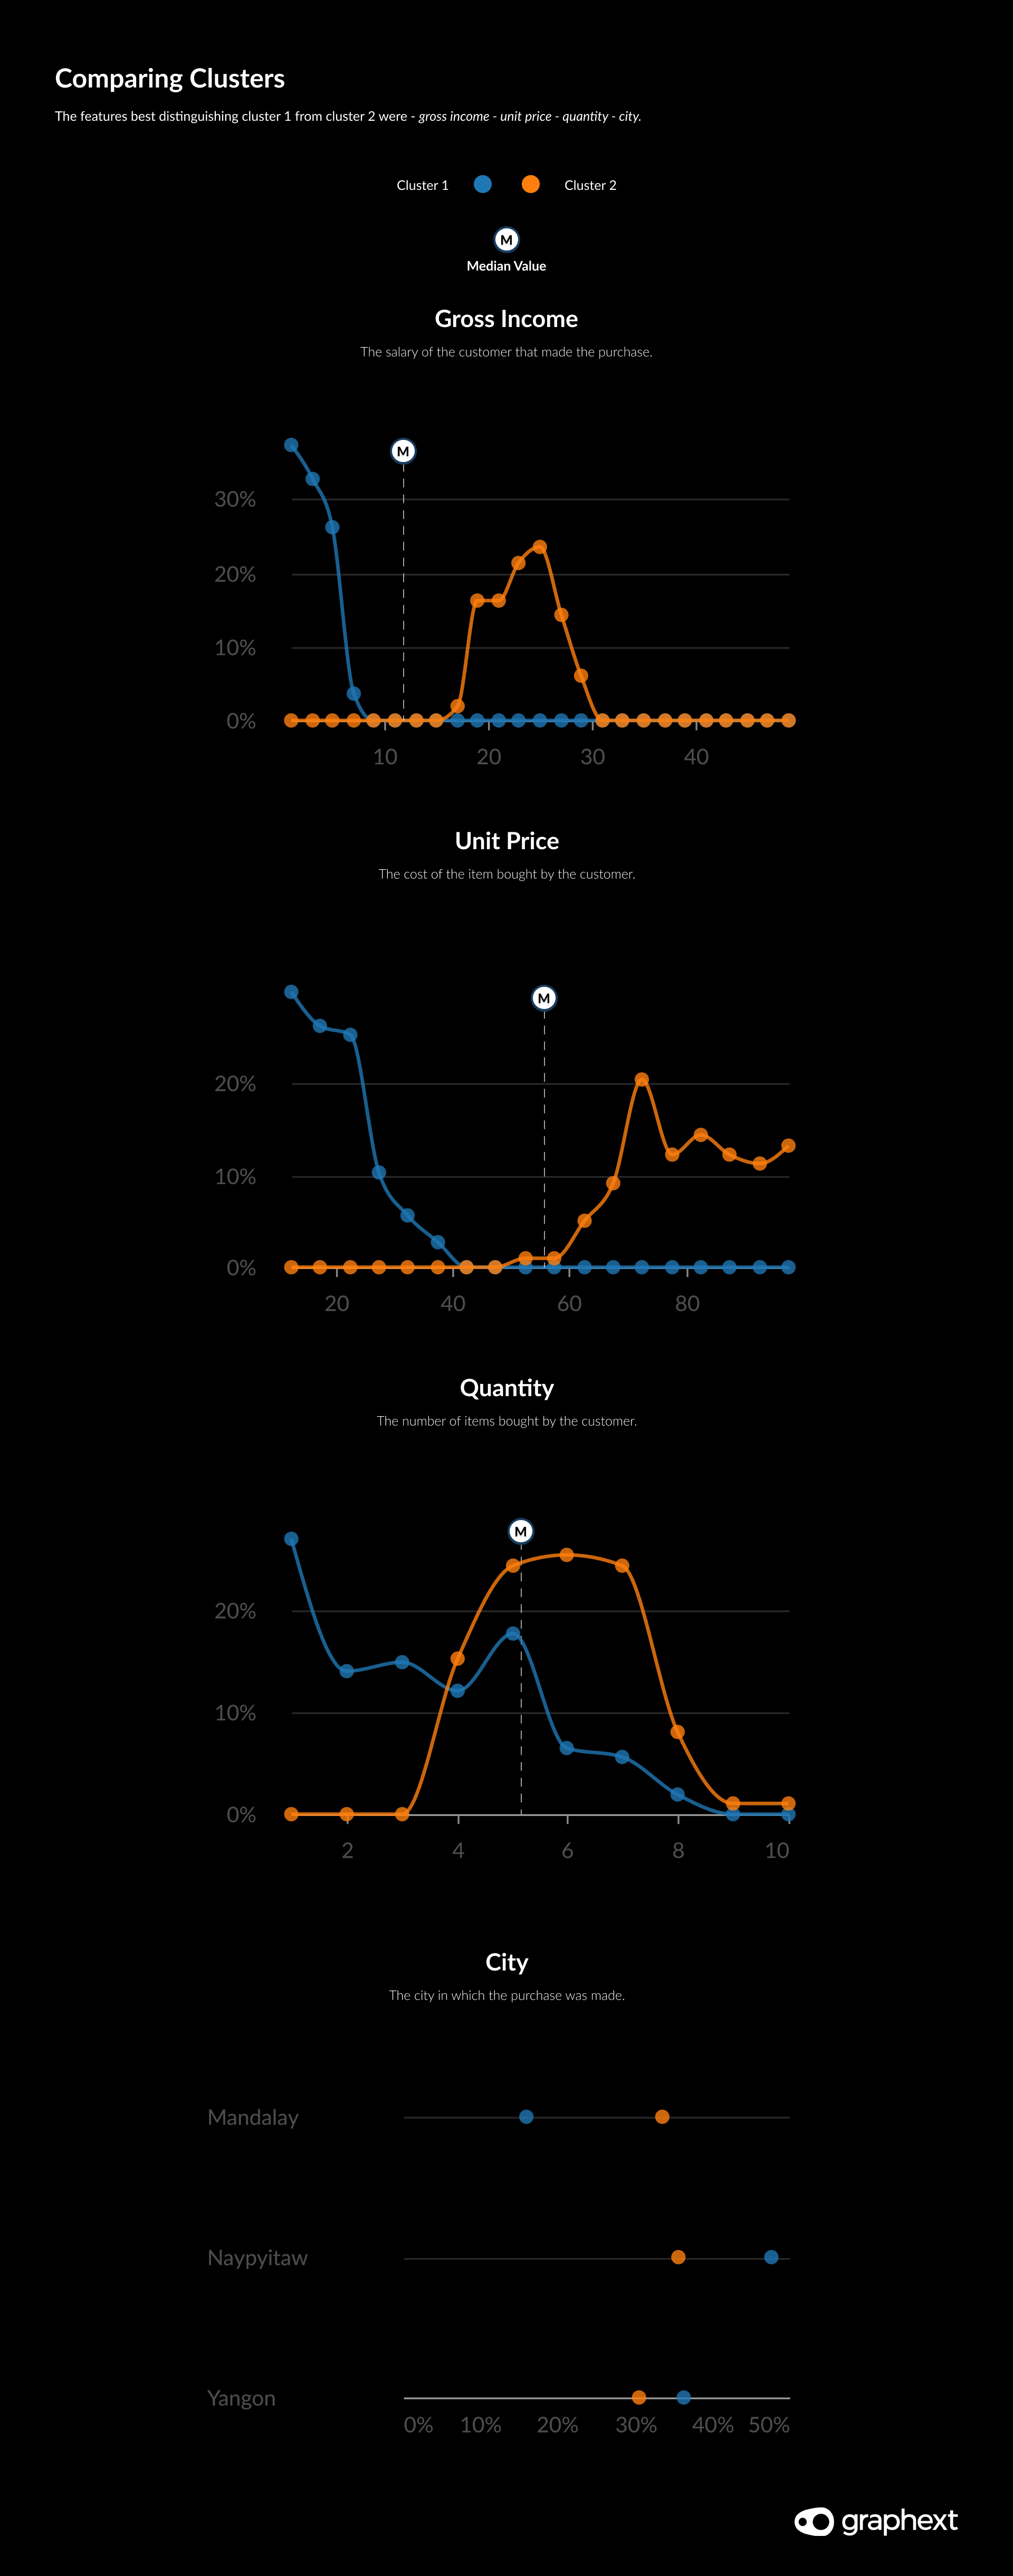
By contrast, customers belonging to cluster 1 typically made purchases that had a low total spend on items with a low unit price and were made in the city of Naypyitaw. This becomes interesting when you consider the rating for sales in each cluster. Customer sales rating belonging to cluster 1 are significantly higher than those belonging to cluster 2. Although these scores could be based on the store or amount spent, it is also feasible that cheaper items are seen as better value for money.
Cluster 4: Customers with Low Membership Rates
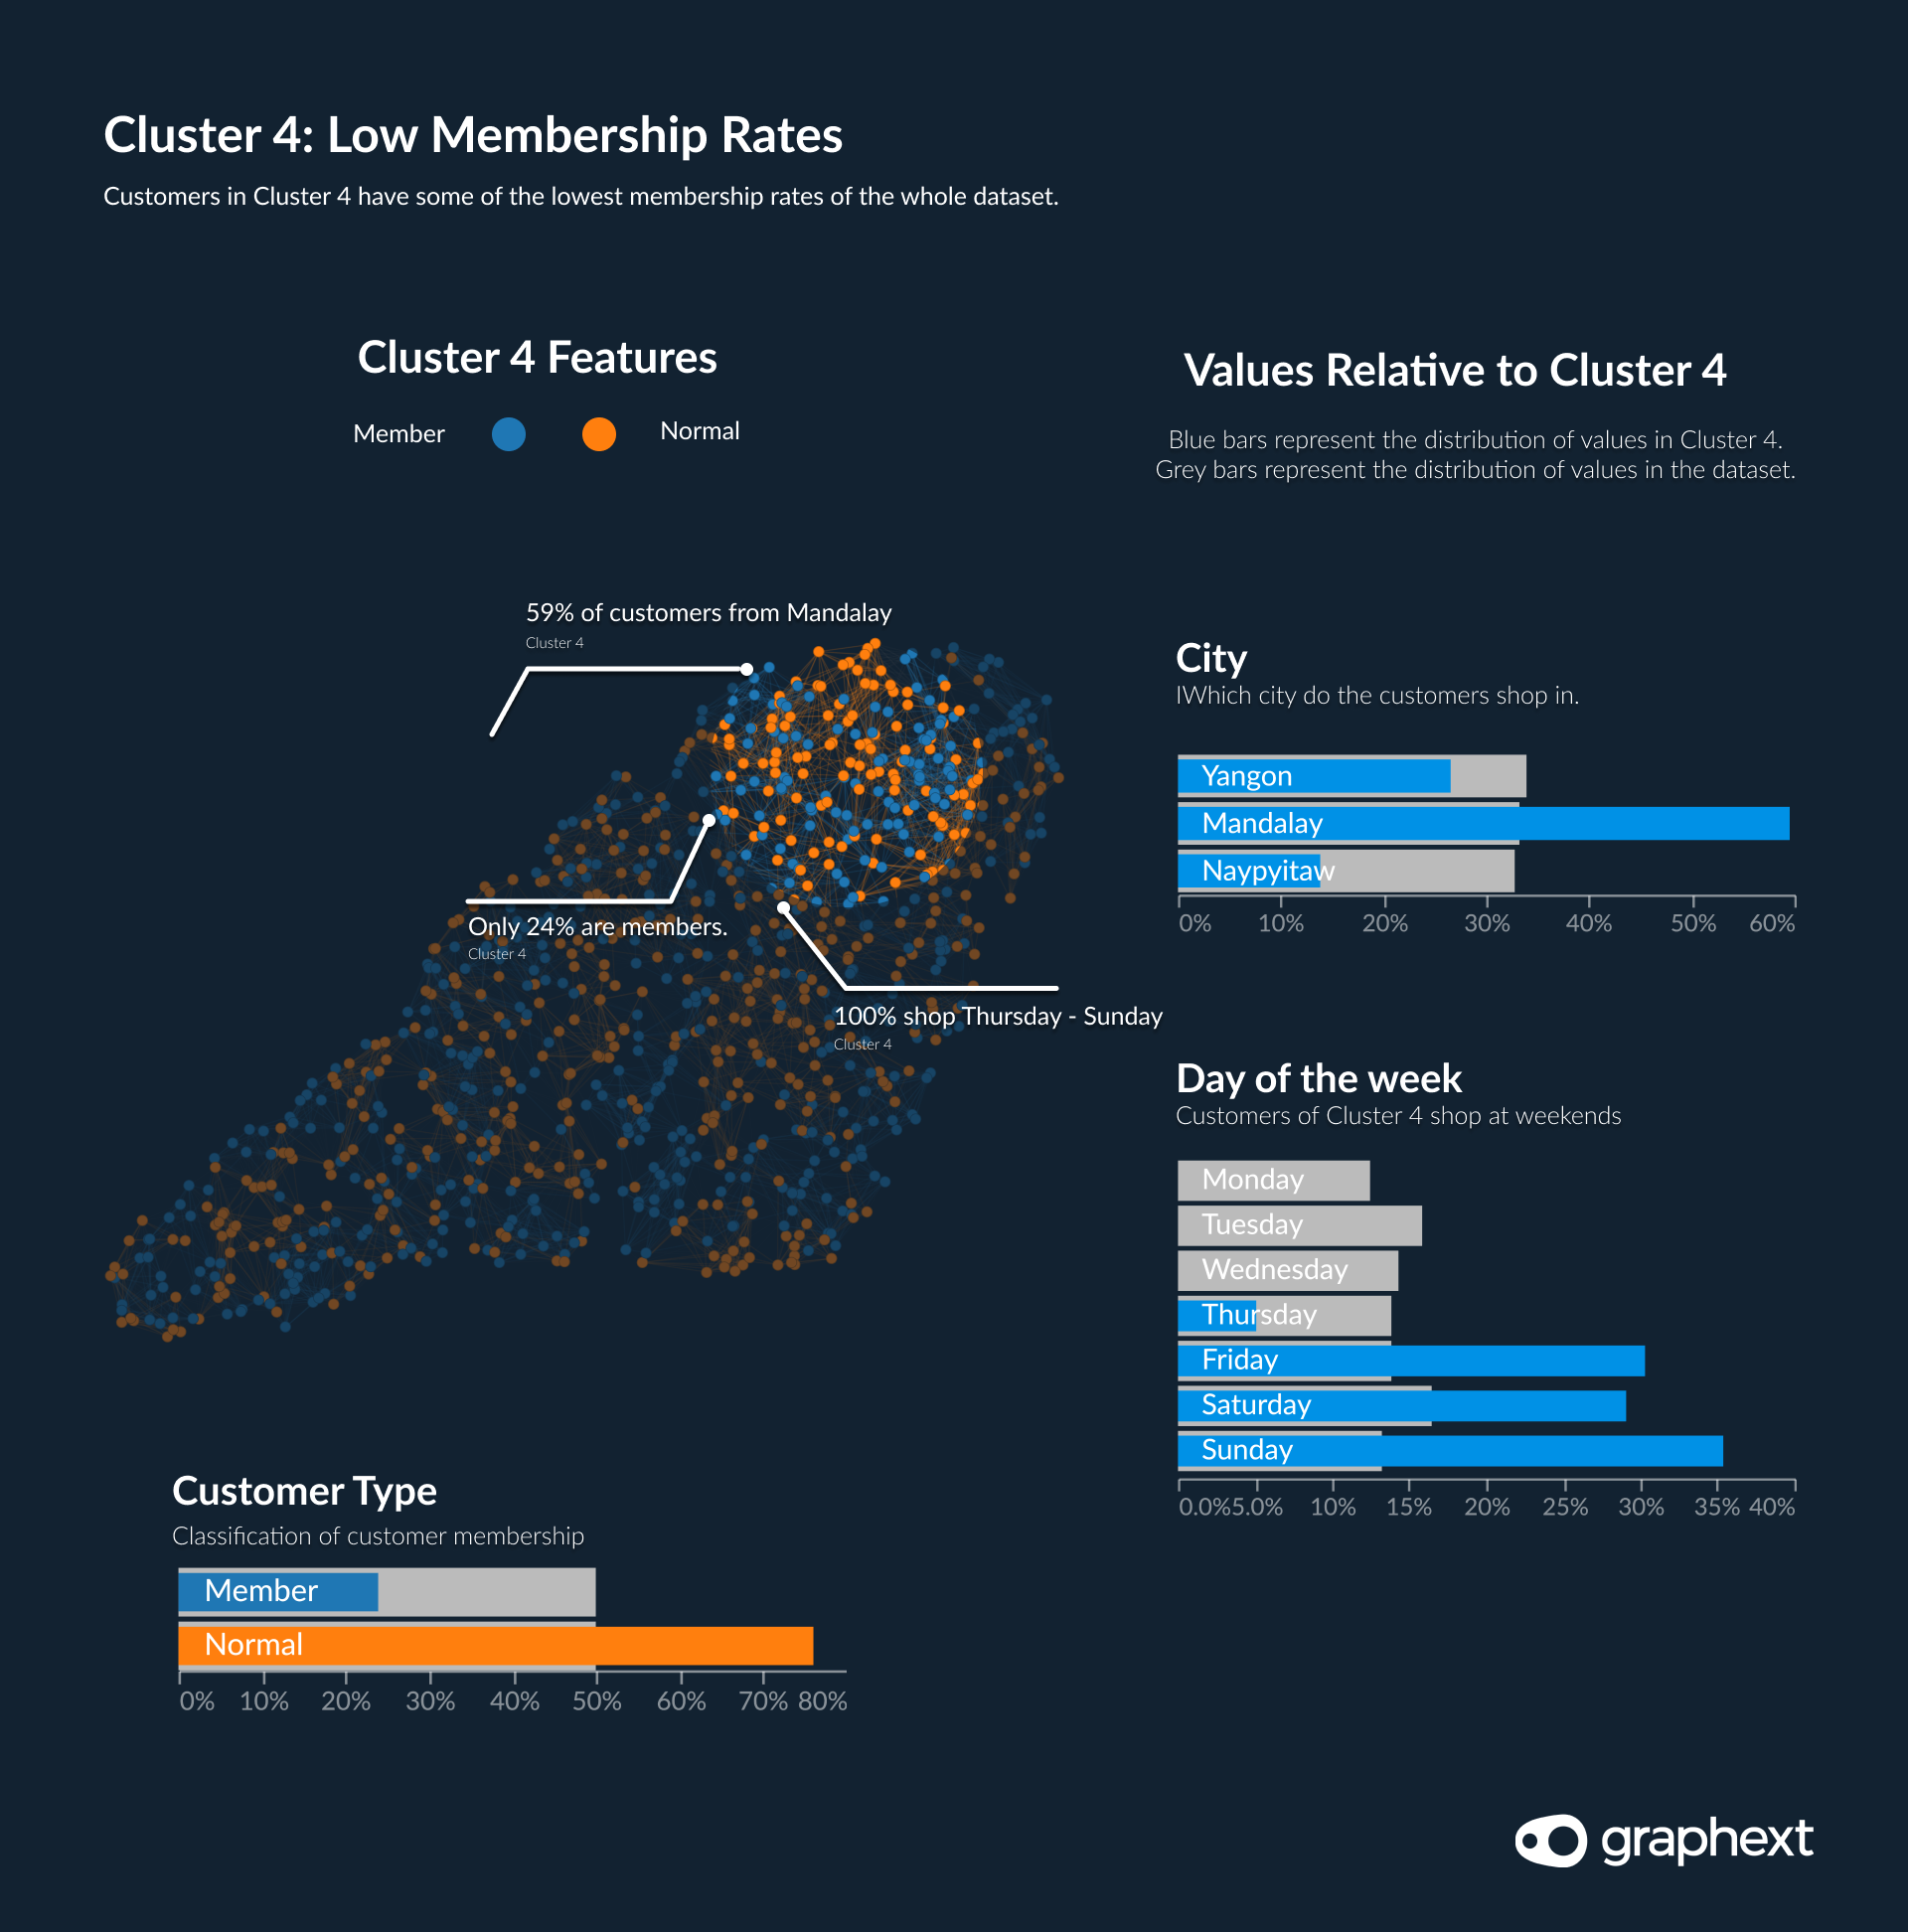
Customers in cluster 4 piqued our interest based on their low membership rates. Of all clusters, setting cluster 4 apart from other clusters was the fact that it featured a low amount of customers classed as members of the supermarket. This insight signified that the customer base in cluster 4 was full of potential.
Targeting customers in cluster 4 with clear strategies and an informed marketing campaign designed to encourage them to become members could be an effective strategy. But where to target it? We checked the distribution of values cluster 4 and could see that Mandalay had the most customers in Cluster 4. Geographically speaking, it would make sense to start here.
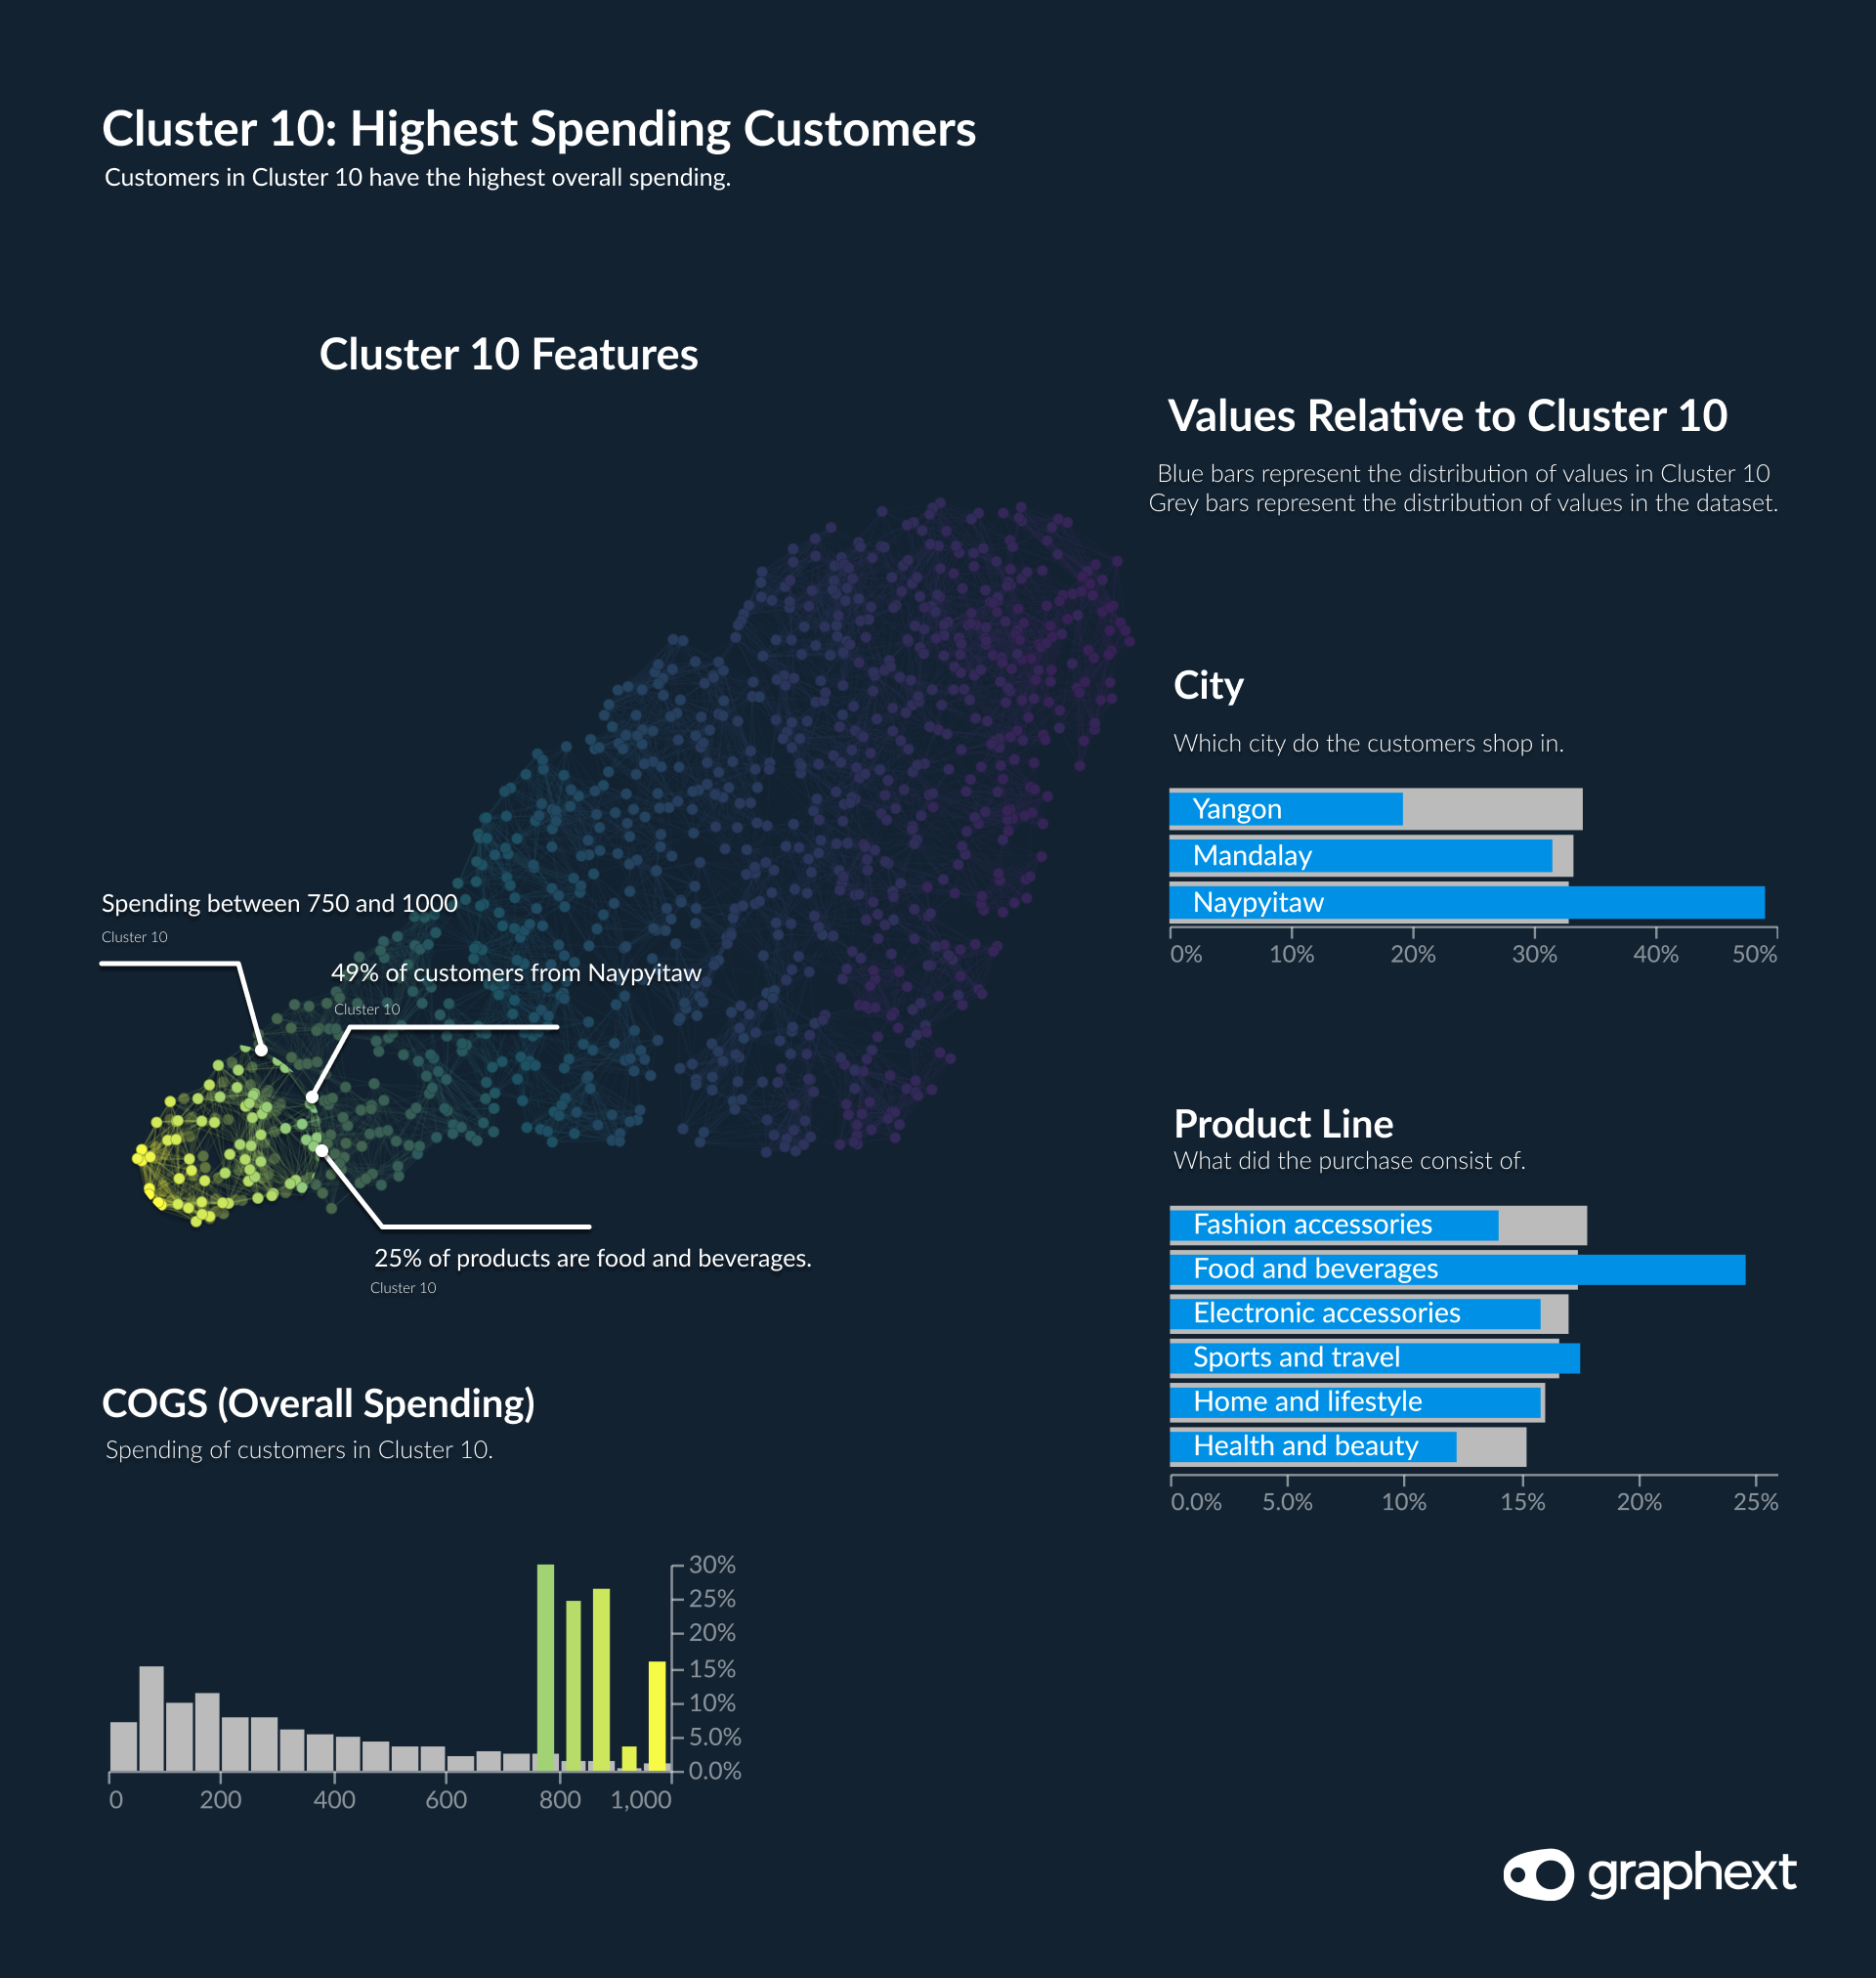
Cluster 10: Identifying the Highest Spending Customers
Another cluster that stands out against the rest is Cluster 10. What is interesting about this particular cluster is represents a high density of the supermarket's highest-spending customers. We know this as their COG (overall spending) is between 750 and 1k. But what else defines these customers?
- 49% of the customers in this cluster are in Naypyitaw.
- Thursday to Saturday are the prime shopping days in this cluster.
- The gender of the customer is relatively even, with 54% being women.
- At 29% of the cluster, food and beverages were the main purchases of Cluster 10.
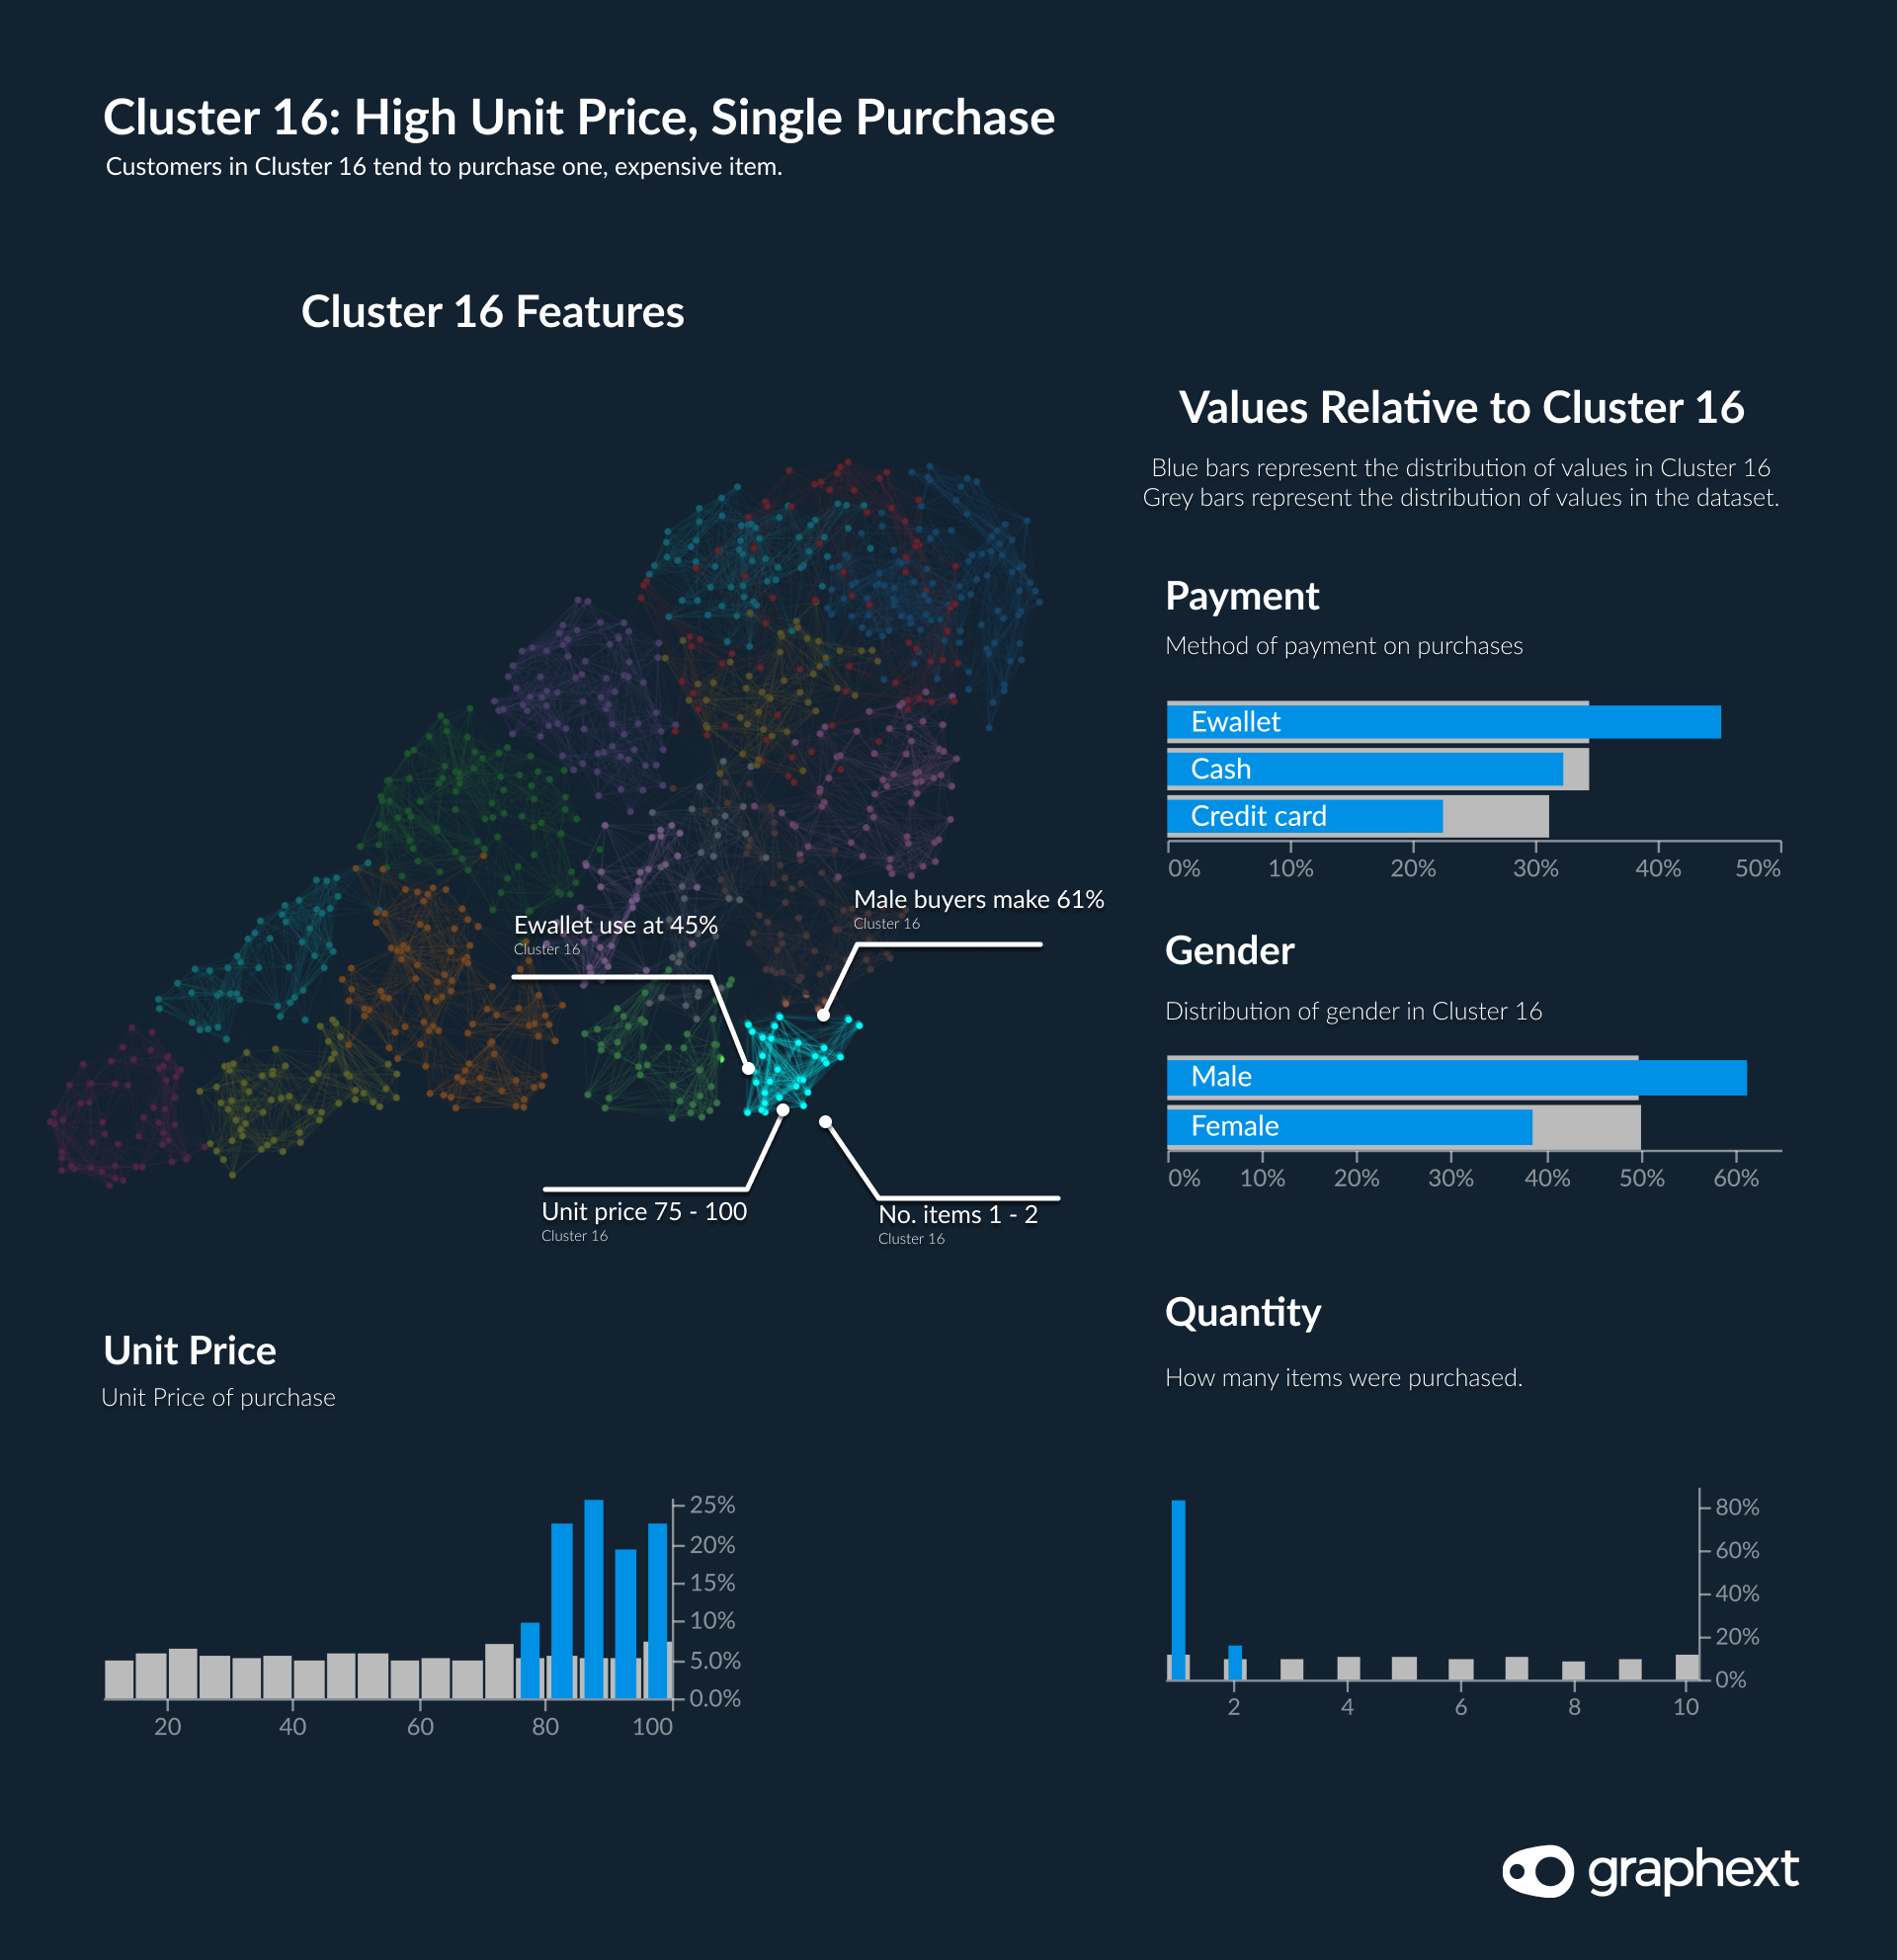
Cluster 16: A Market Segment with Single, Expensive Purchases
For marketing strategies, it is useful to understand which market segments represent upsell opportunities. Single purchase customers are prime candidates for this, especially those buying more expensive items. Identifying who these customers are and what their defining characteristics were can really help to inform and direct marketing strategies.
This pattern of single purchases with a high unit price was particularly prevalent in Cluster 16 - where all customer purchases were for units priced between 75-95 but also purchased in isolation or with one other product. Who were these customers?
- They were predominately male - 61%
- Buying electronic accessories.
- Shoppers paying by E-wallet were overrepresented in the cluster - 45%
- The largest percentage were shoppers in Yangon.
Inspection of these clusters of associated customers tells us that an increase in promotion for memberships in Mandalay could increase loyalty amongst this specific customer base. What's more, the supermarket should look towards cluster 10 - their most valuable cluster of customers - contemplating the defining features of the data here in order to understand ways to drive engagement. The features of clustered customers exposed in this market segmentation analysis could - and perhaps should - have direct impacts on the marketing strategies enacted by the supermarket. Using defining features to inform specific campaigns using market segmentation would be an effective way of preventing customer churn and maintaining loyalty.
On this page
- Note:
- Supermarket Customers: What's in the Data?
- 13 Factors
- 1 Target
- Here's a bank of resources to help you start segmenting customers using Graphext.
- Segmenting the Market: At a Glance
- Comparing Clusters of Associated Customers
- Cluster 4: Customers with Low Membership Rates
- Cluster 10: Identifying the Highest Spending Customers
- Cluster 16: A Market Segment with Single, Expensive Purchases