Survey Analysis Using Graphext
Survey is an easy way to gather people’s opinion or behaviour, but the challenge has always been once you have all the data, what do you do with it? First of all, data gathered from surveys can be numerical, categorical, ordinal… and finding relations among them can be very challenging. In addition, you may have some preliminary questions you want to answer, but these hypothesis may bias your analysis.
With Graphext, you can combine all types of data and auto-segment it without supervision. That way, you can find real patterns in data easily.
Let’s walk the walk with a real example!
In 2015, Fernando Mendez with the Preference Matcher research consortium (http://www.preferencematcher.org) organized a survey asking a sample of 20,000 people questions about their political opinion and vote intention. The survey consisted of 30 questions, and is complimented with demographic information for each participant.
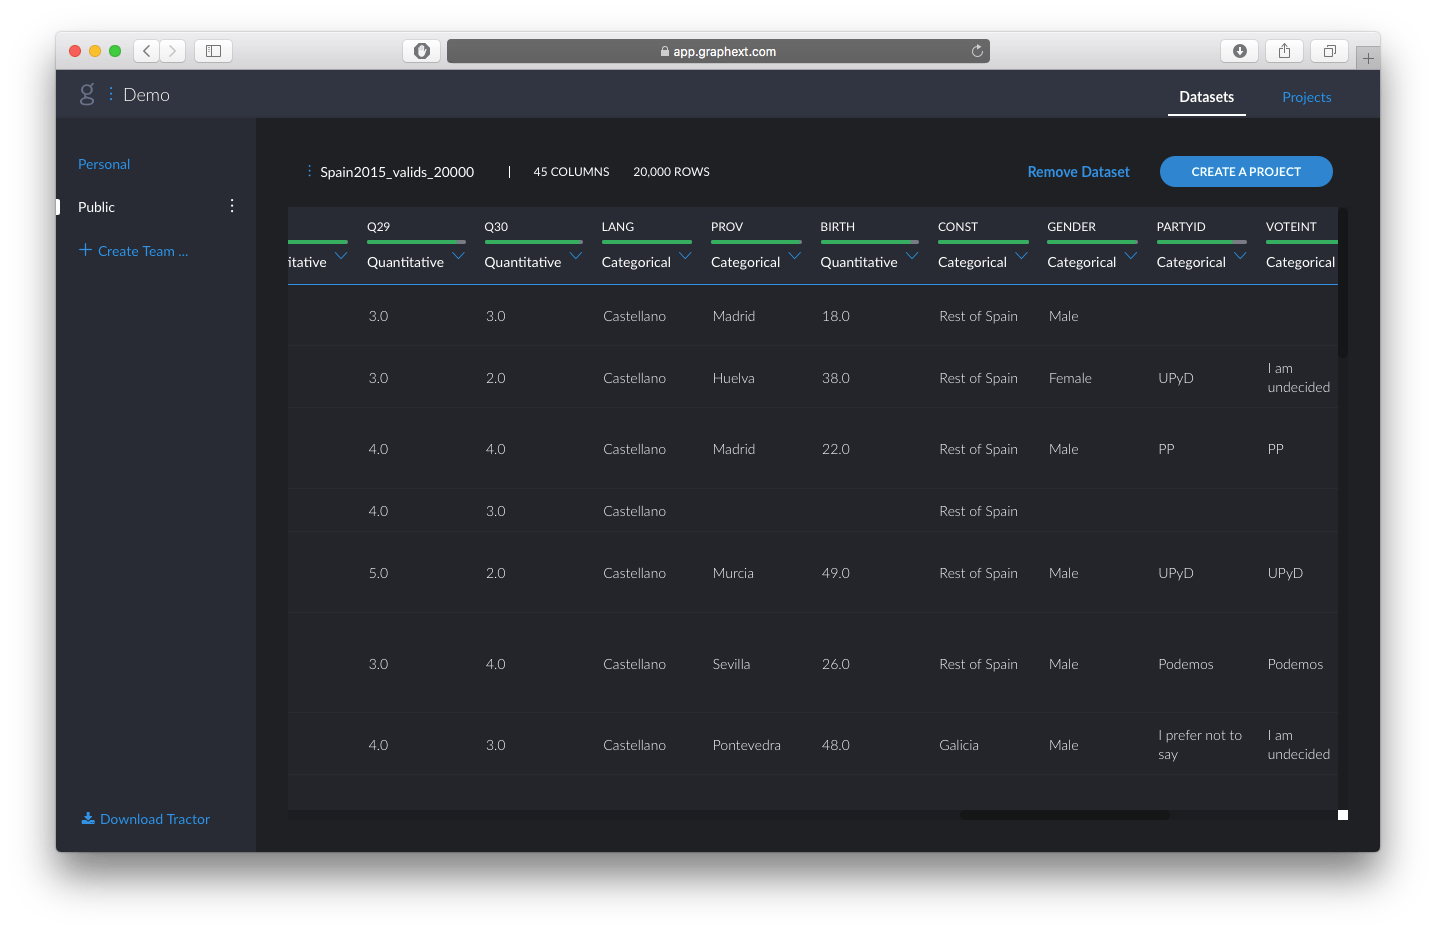
We uploaded the survey result in .csv file to Graphext and took a look at it. Although the data comes in all types, Graphext could automatically detect their structure to prepare it for analysis.
We are interested in analysing patterns in people’s answers to ideology questions, and not use their demography or vote intention. We use those parameters in our algorithm when creating our project.
Let’s take a look at the what the data could tell us about people's political ideology.
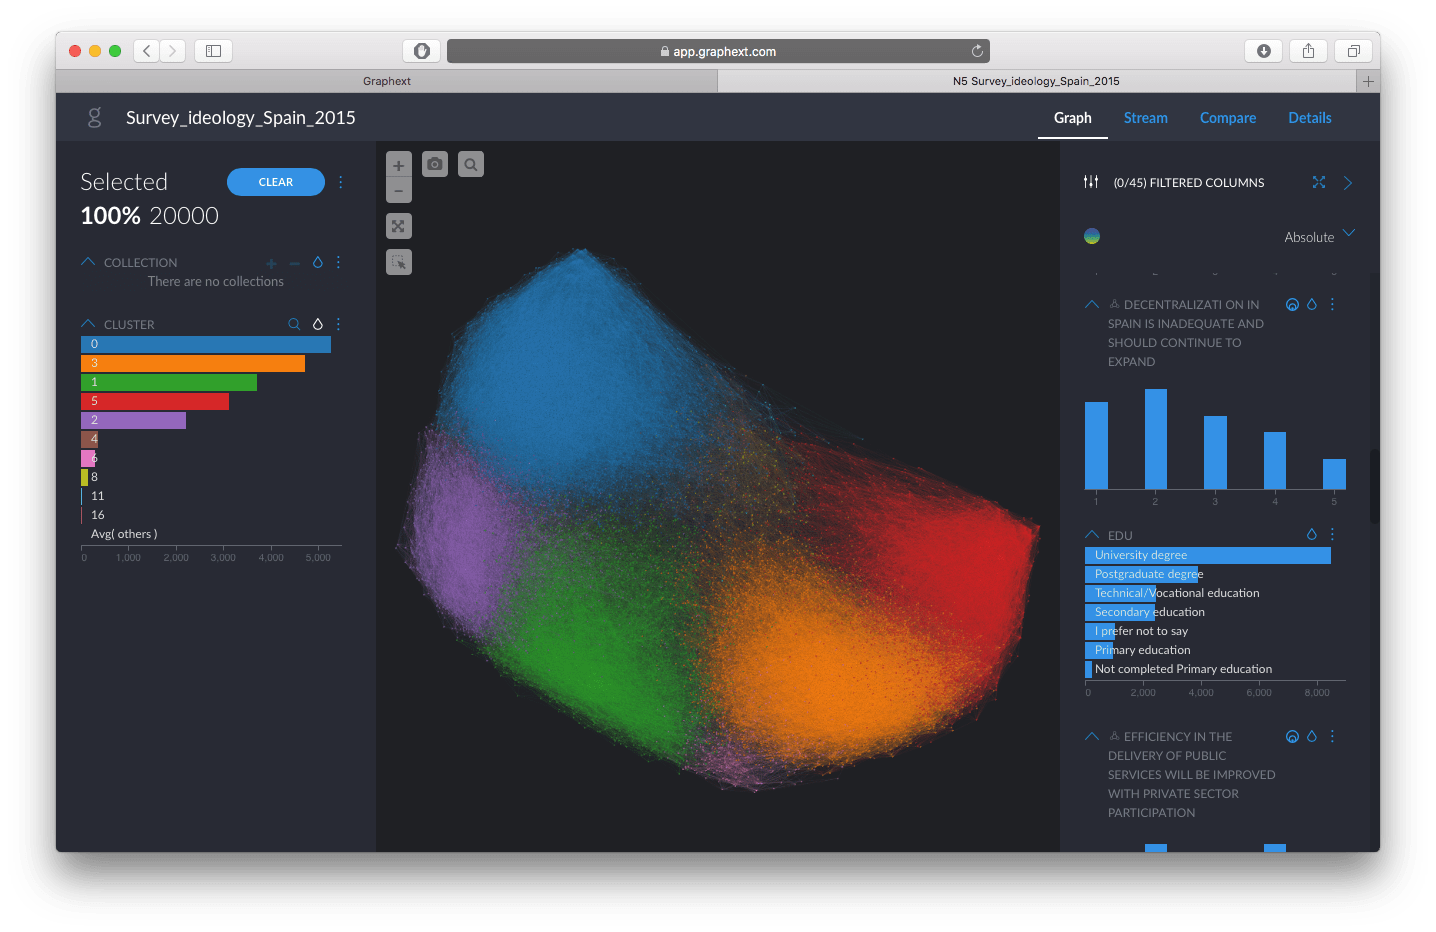
Nice! We can see that Graphext has found 10 main opinion groups. To understand how they are defined, we can click on one of the clusters, and automatically we can see on the right side panel the questions the questions that mostly separated this group from the rest of the population.
In this case, we can see that this group is defined by being in favour of “The central government should control the spending of regional governments to limit their indebtedness”, they are against “Catalonia must be recognised as a nation” and in favour of “Negotiations with ETA weaken the state” and “The growth of Islam is a threat to the security”. These are the questions that differentiate this group from the rest of the population, seems like we could qualify them as the conservatives.

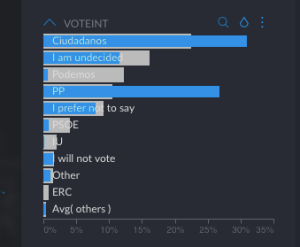
Let’s now see their vote intention. Seems like they are divided between Ciudadanos and PP. But some of them want to vote for Podemos, which is against our intuition because Podemos is a leftist party. Who are these people? Well, with one click, we can easily find out the reason. It seems like their main differentiation is their “Vote Reason”. They vote mainly “to punish the established parties”.

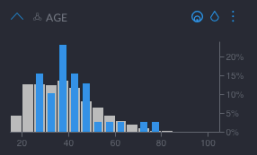
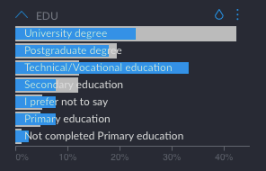
We can also see other variables that define them, such as demographics. These people mostly hold Technical education degrees, and are around 35-45 years old.
This is an example of an insight we were not expecting, and a question we did not have at the beginning. Graphext is allowing us to have a dialogue with the data so we could understand its story.
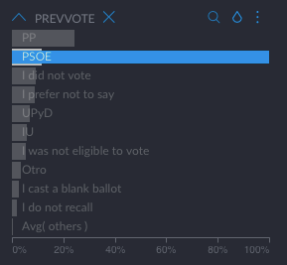
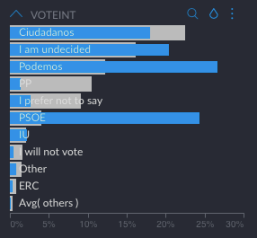
But there is much more we could do with Graphext. Instead of using unsupervised clusters, we can also create our own filters to define and compare data segments. For example, let’s investigate how people change their vote intention from one year to the next. Let’s take people who voted for PSOE in the last elections. Who do they intend to vote for now? Apparently, those who have decided are divided into “being loyal to PSOE”, and “changing to Podemos”.

Using those filters, we can manually create data segments (called “Collections”) for further analysis.
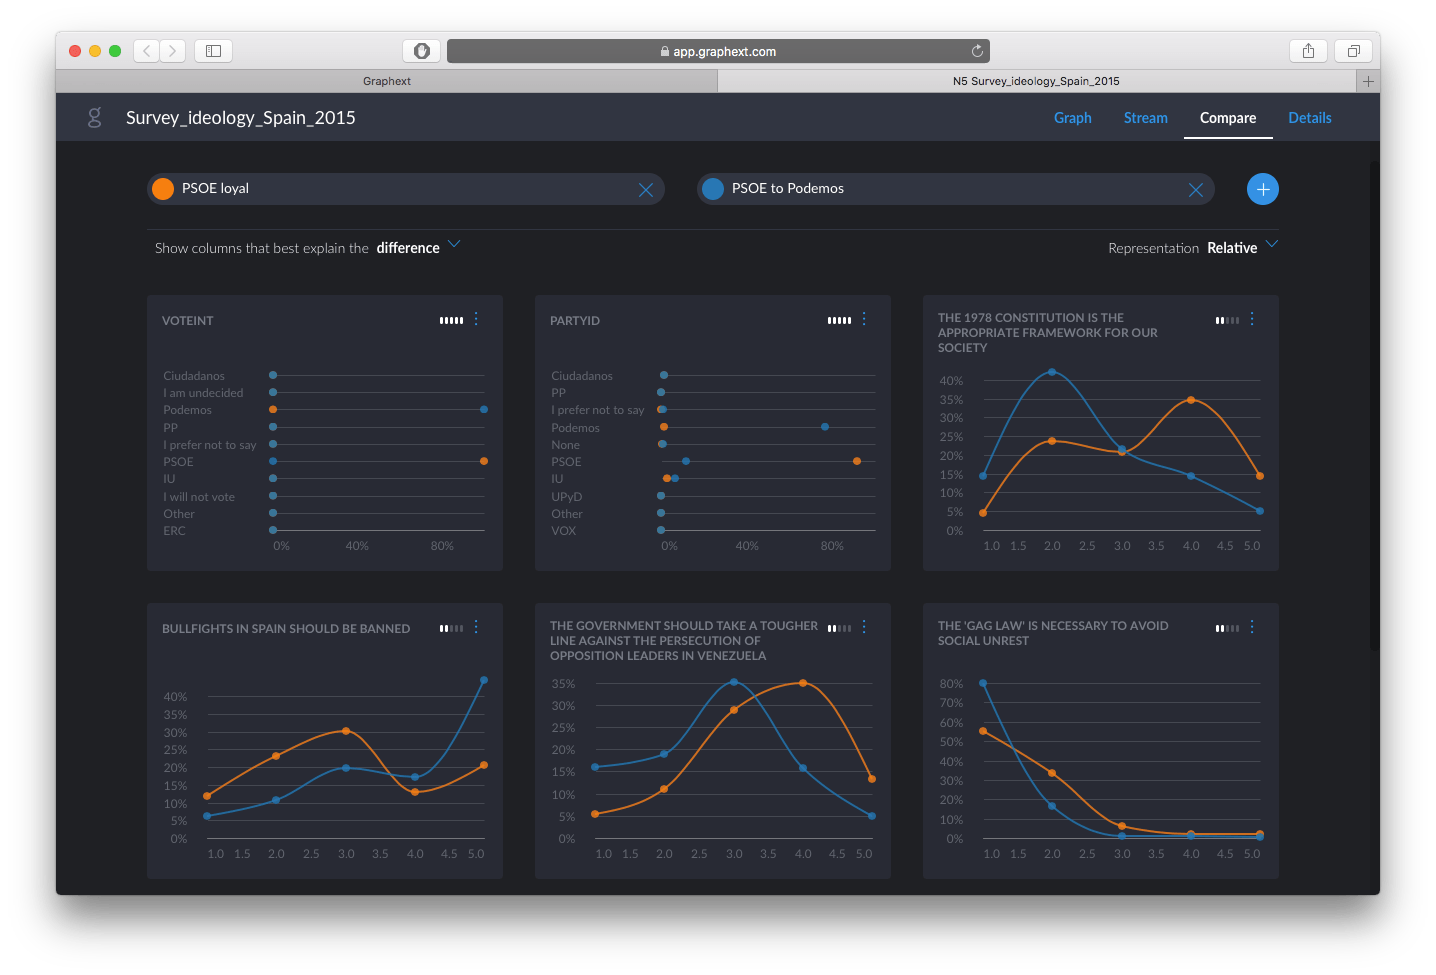
Let’s now compare those groups, and check their opinion patterns. The “Compare” section allows us to identify automatically the questions that most differentiate these two groups. Participants who decided to switch to Podemos do not agree with “The 978 constitution is the appropriate framework for our society” while loyals to PSOE are in favour of that question. Also bullfighting is a hot topic dividing these two groups, seems like people who decided to vote for Podemos are very in favour of “Bullfights in Spain should be banned”, whereas PSOE loyal opinion is very evenly divided.