
The Evolution of American Protests After the Death of George Floyd: COVID-19, BLM and the Election
Using data from The Armed Conflict Location & Event Data Project (ACLED) we mapped and analyzed 17,946 demonstration or protest events in America throughout 2020. Our clustering model highlighted the impact of the Black Lives Matter (BLM) movement on the landscape of political engagement in the USA this year as well as showing how events surrounding the general election and COVID-19 also contributed to busy streets across the country.
2020 has been a turbulent year for every country but particularly in the USA. Civil unrest surrounding the pandemic has been compounded by Black Lives Matter (BLM) demonstrations as well as by a disruptive national election. Using data collected by the US Crisis Monitor from ACLED and the Bridging Divides Initiative between May 24 - Nov 28, we clustered 17,946 demonstration events to investigate the relationships between topics of demonstration, locations and violence.
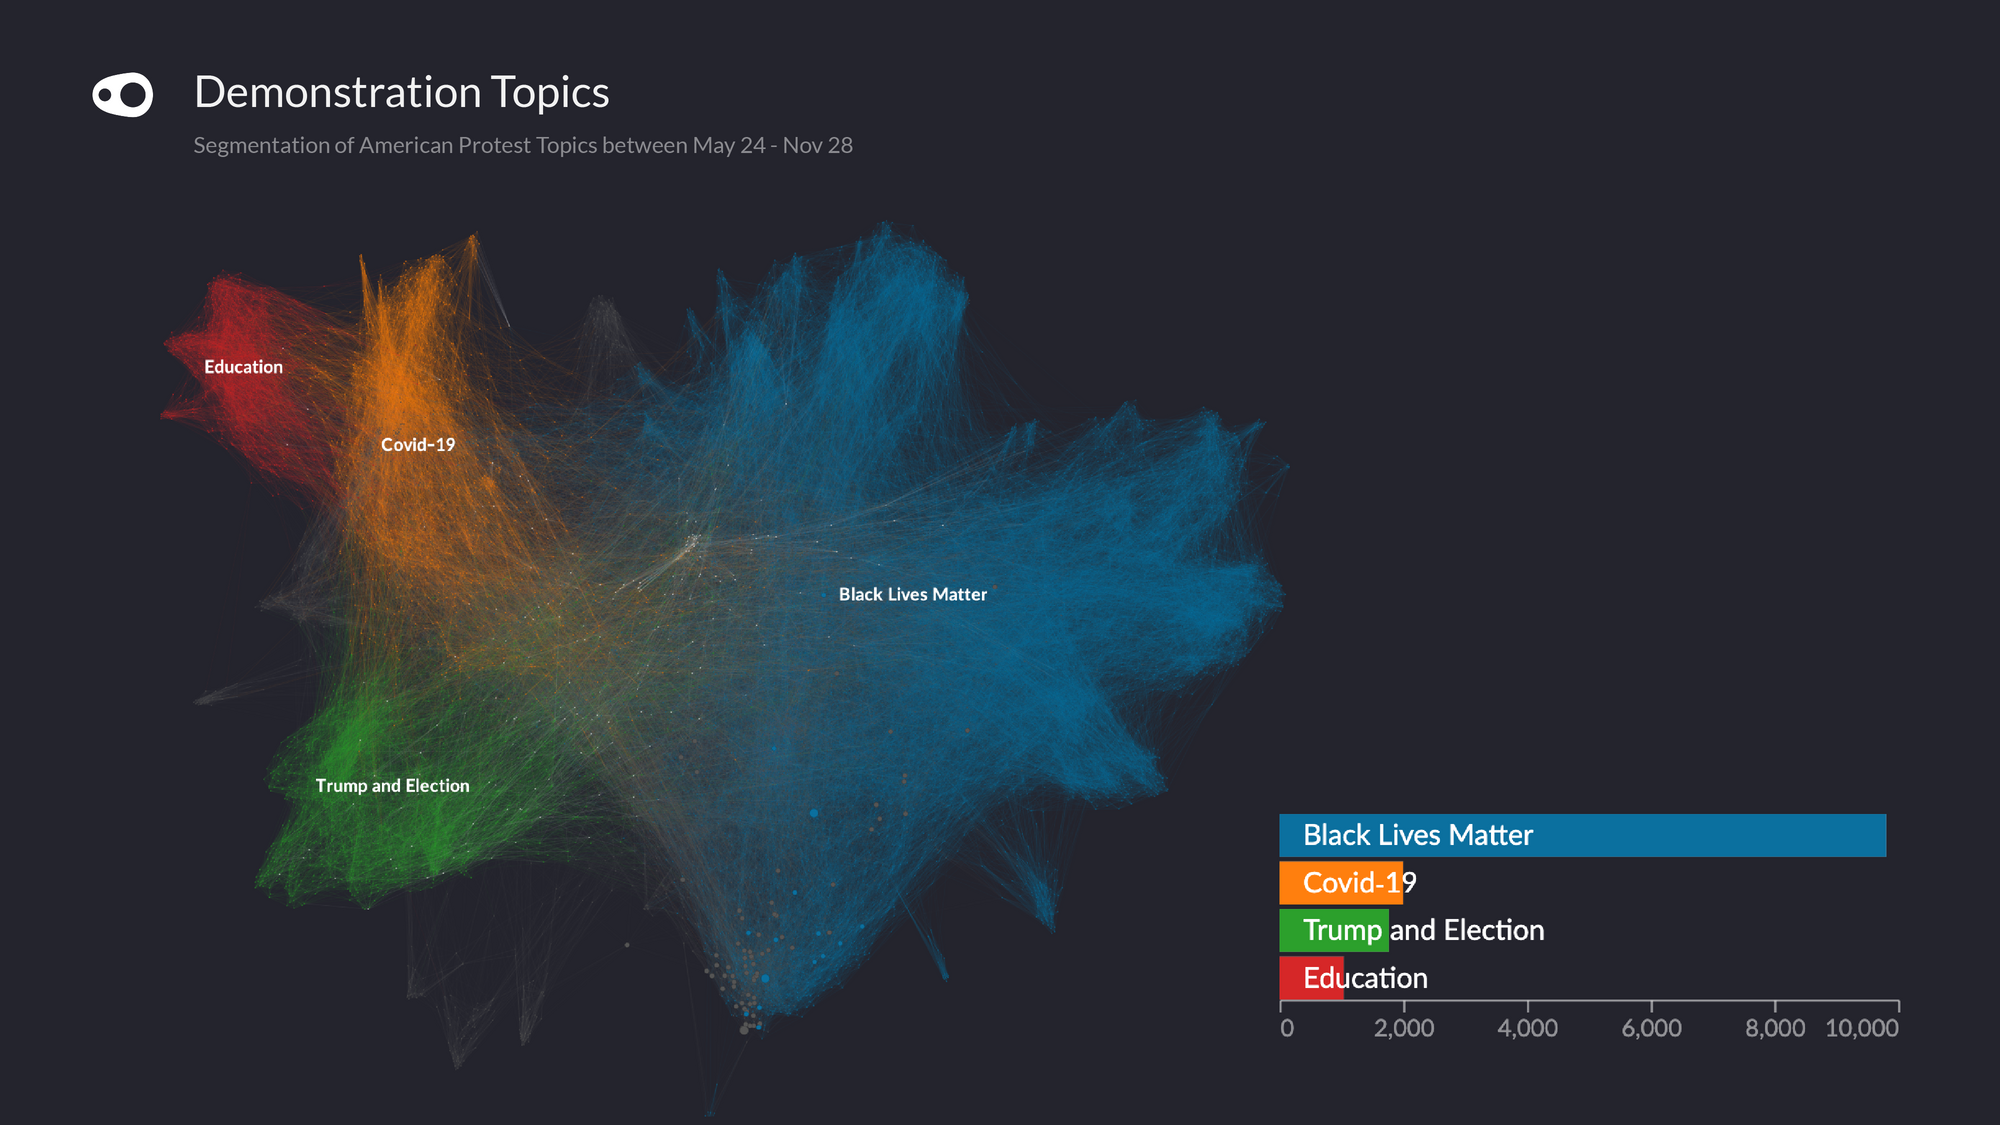
Graph: The four demonstration topics prevailing in America this year.
BLM Shaped the Landscape of American Protests
The Black Lives Matter movement which swept through the USA after the killing of George Floyd on May 25th was the driving force behind American demonstrations this year. There were almost 10,000 protests associated with BLM in 2020. In direct and immediate response to George Floyd's death, the early summer months of May and June were witness to a dramatic spike in the number of demonstrations taking place on American streets.
There were almost 10,000 demonstration events associated with Black Lives Matter in America this year.
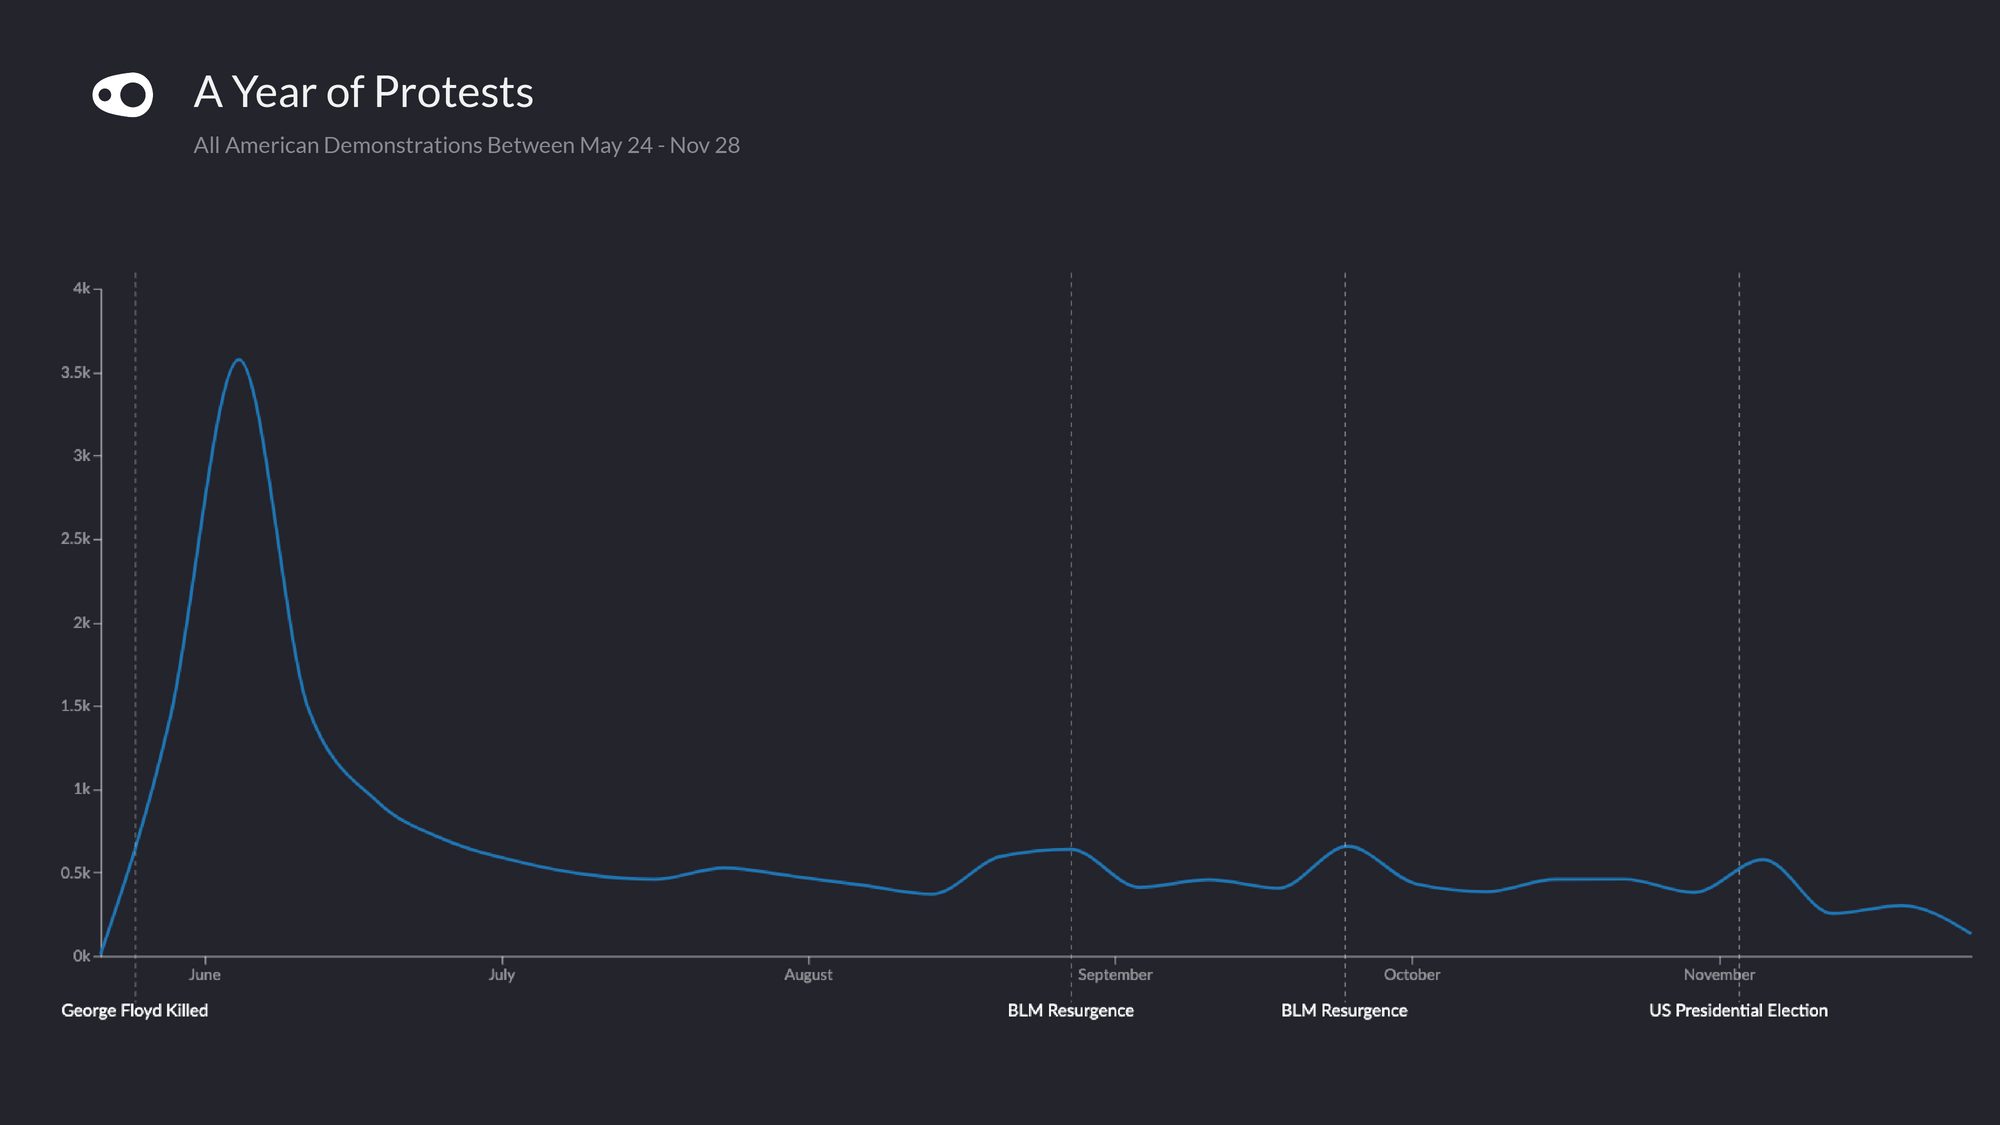
Trends: The evolution of American protests between May 24 - Nov 28.
On top of the wave of BLM demonstrations in the early summer, August and September also saw a resurgence in the number of organised events associated with BLM. Although these demonstrations make up over half of the events in our data, division and unrest surrounding the pandemic kept the rate of protests on American streets at a consistently high level throughout the year.
Anti-lockdown protests, which spread across the country and received international criticism, were often organized by conservative groups and attended by far-right militias as well as ordinary Republicans. Additionally, the controversy surrounding the presidential election in November gave way to further divisiveness as Americans took to the streets to show support for their chosen candidate or to demonstrate against alleged election fraud.
A Demonstration for Every American
Black Lives Matter protests were significantly more common in areas of the USA that voted for Joe Biden.
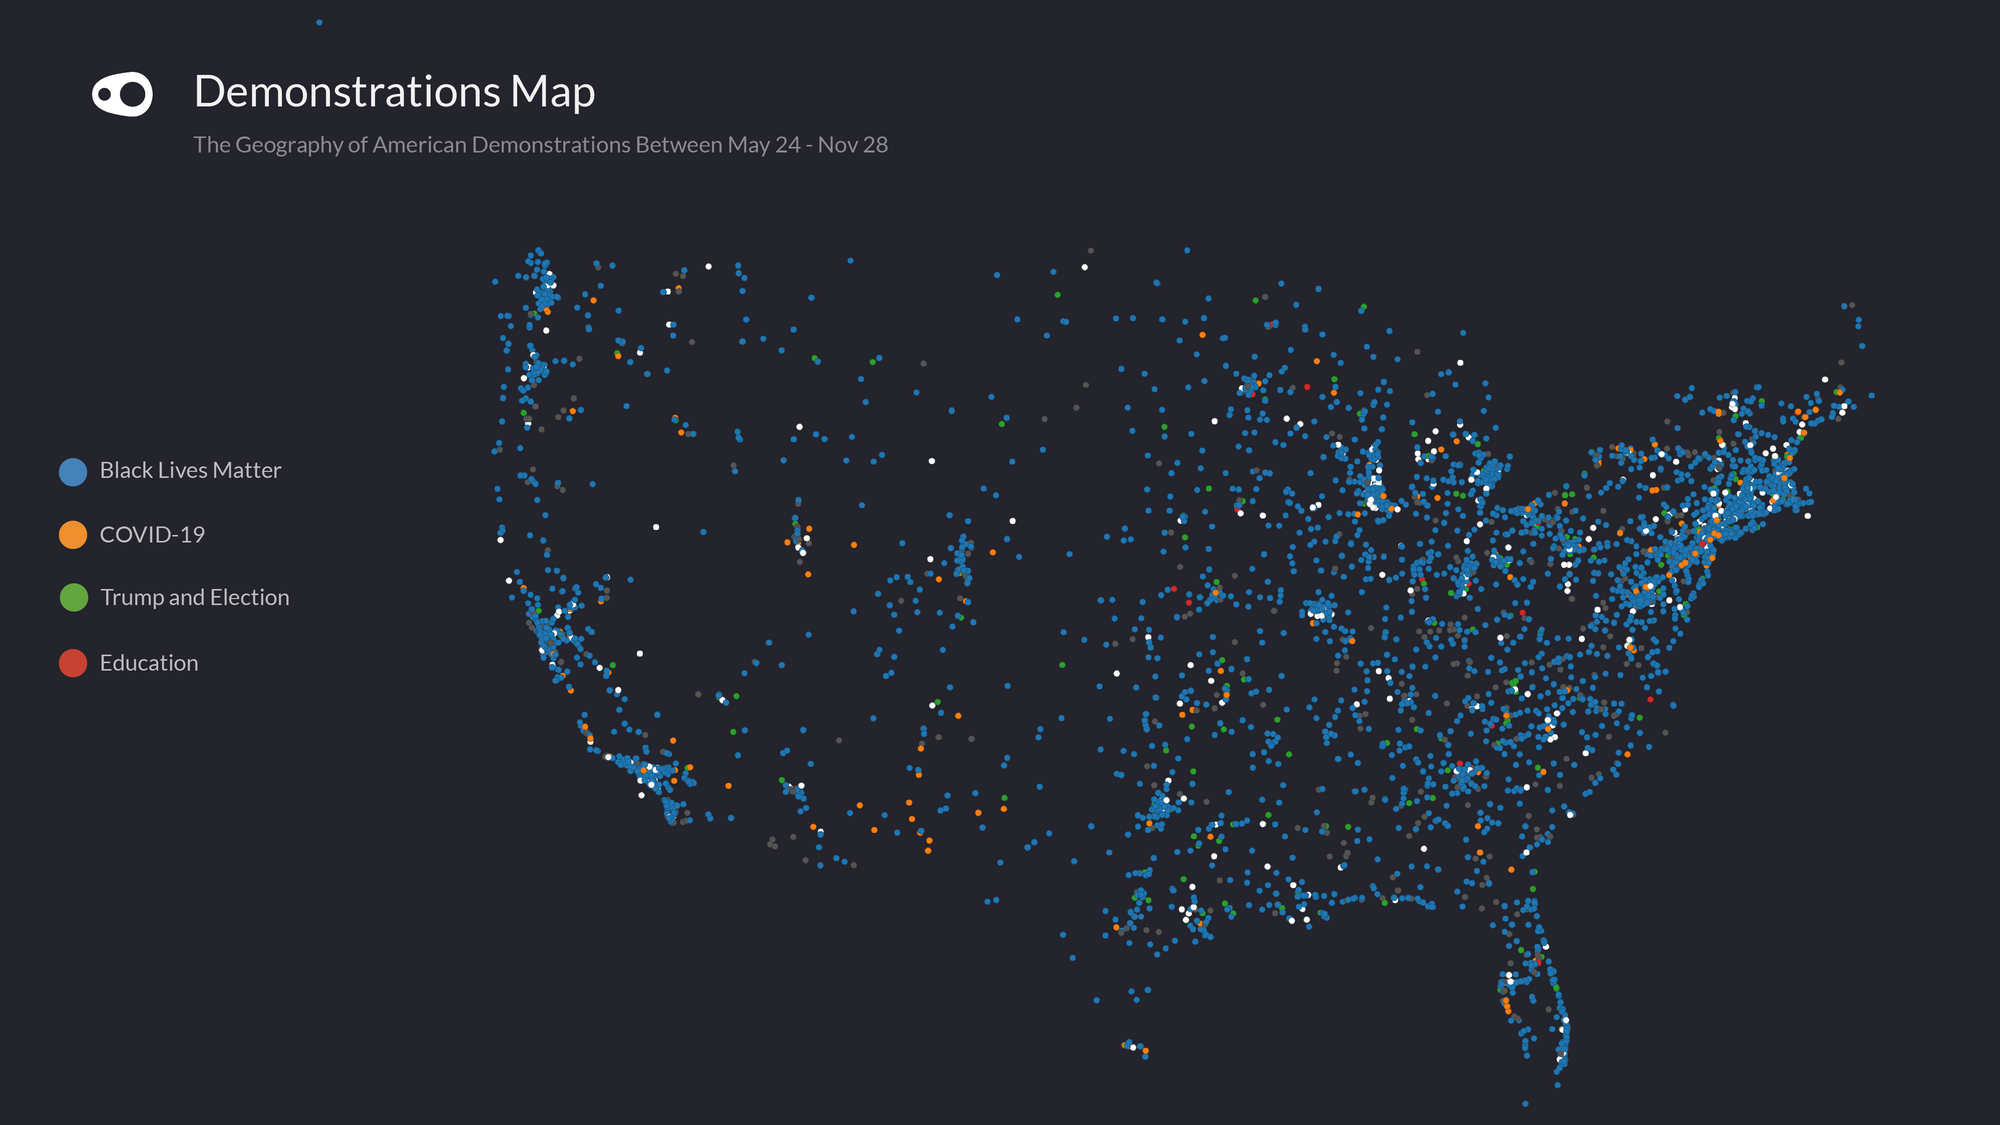
Graph: Here, we used a geospatial recipe to plot protest events using lat/lon coordinates.
There is a trend between higher numbers of BLM protests in areas of the country that supported the Democrats in the presidential election. States supporting the Republicans in November's election, including Nebraska, Kansas and Oklahoma, saw relatively small numbers of BLM demonstrations. In contrast, New York and Oregon, states that helped to elect Joe Biden, saw a high volume of BLM demonstrations. As a Democrat state and the most populous in the USA, California's record of BLM demonstrations in 2020 accounts for over 10% of all demonstrations associated with the movement. Texas, a Republican state and America's second-most populous accounts for under 5%.
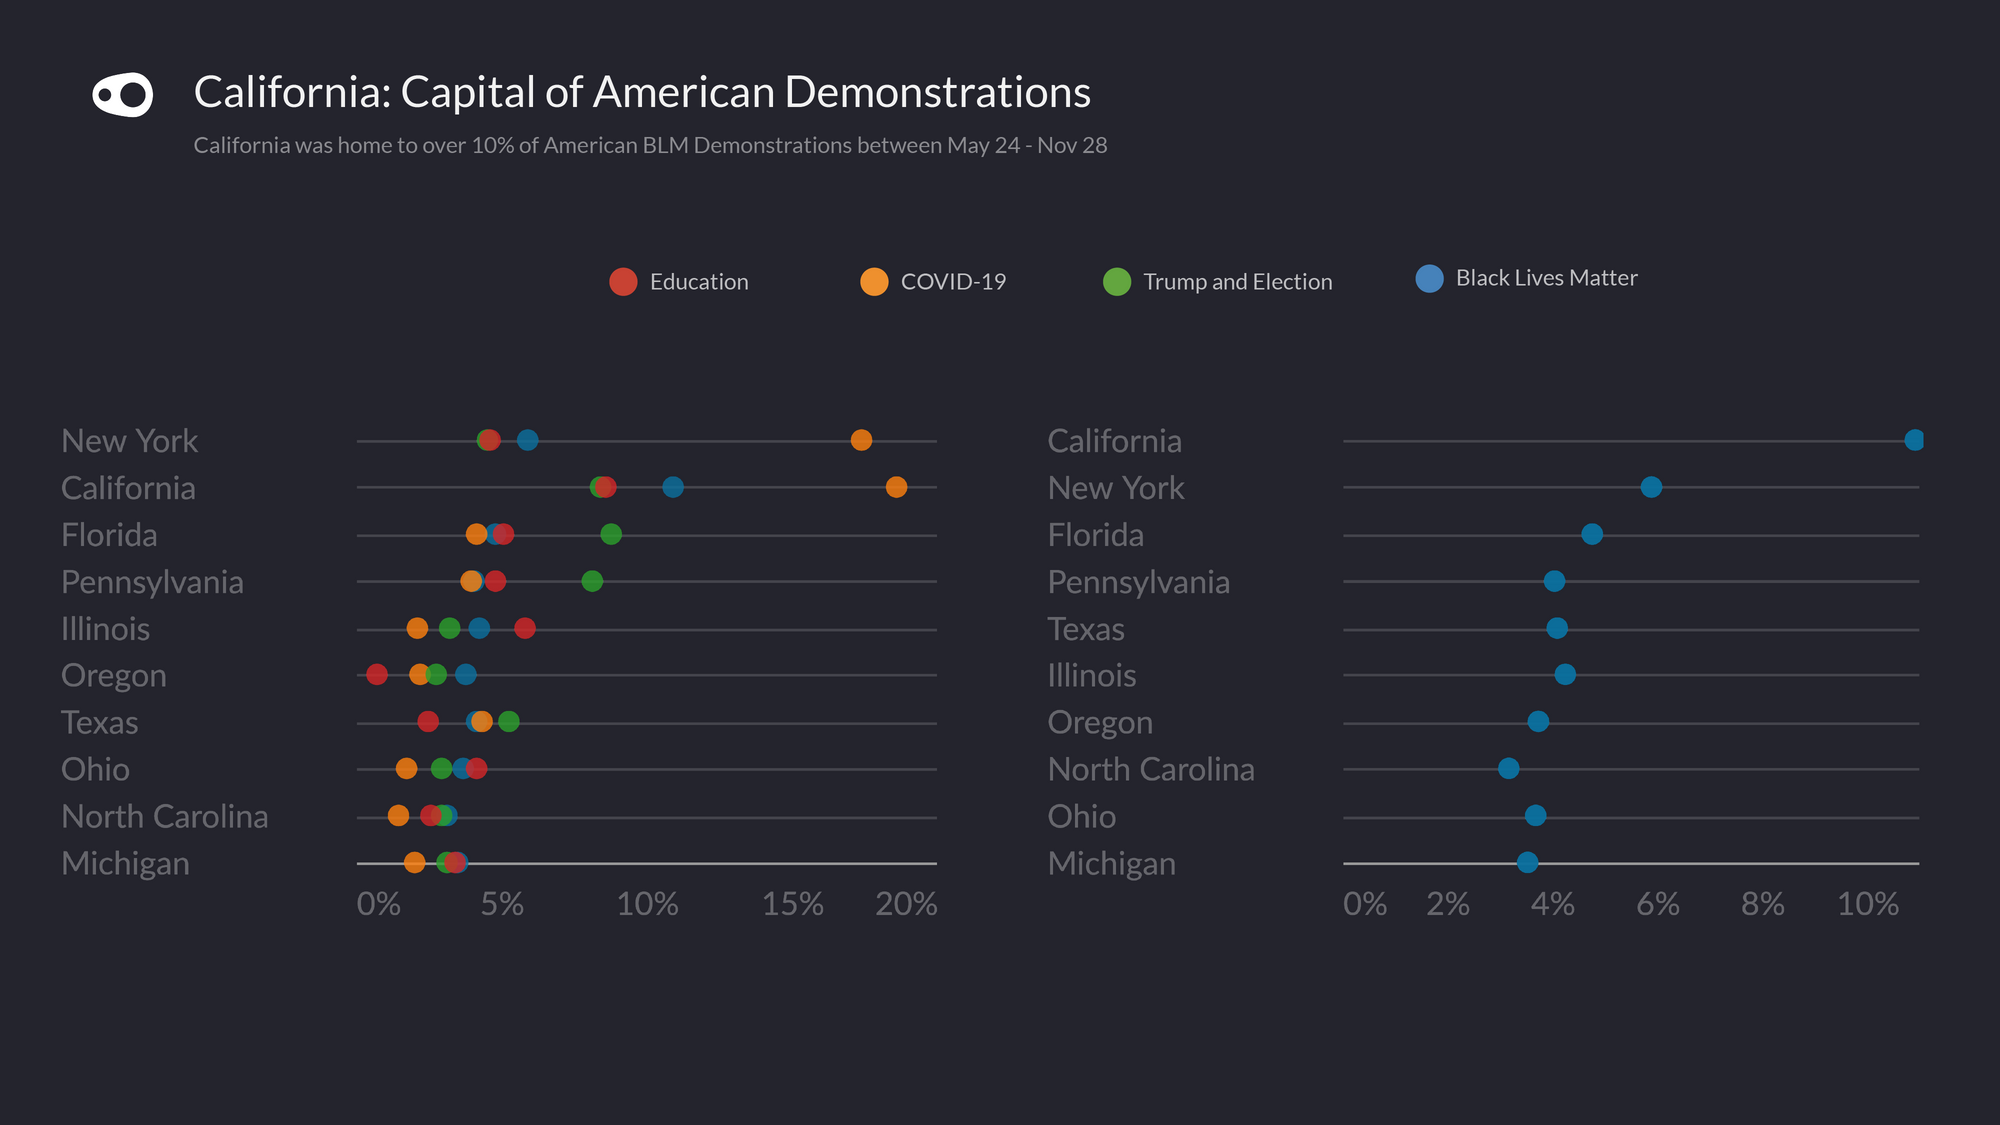
Compare: The locations where demonstrations were most prevalent.
The US Crisis Monitor recorded a total of 85 fatalities associated with all kinds of political violence and demonstration activity during this period. Sources from ACLED suggest that over 20 of these were directly related to demonstration events.
Violence & Peacefulness
Although most events were peaceful, 4% of demonstrations were violent and 3.5% involved police intervention. Violent demonstrations made substantial contributions to the 85 fatalities listed by the US Crisis Monitor between May 24 - Nov 28. Sources from ACLED suggest that over 20 of these were directly related to demonstration events.
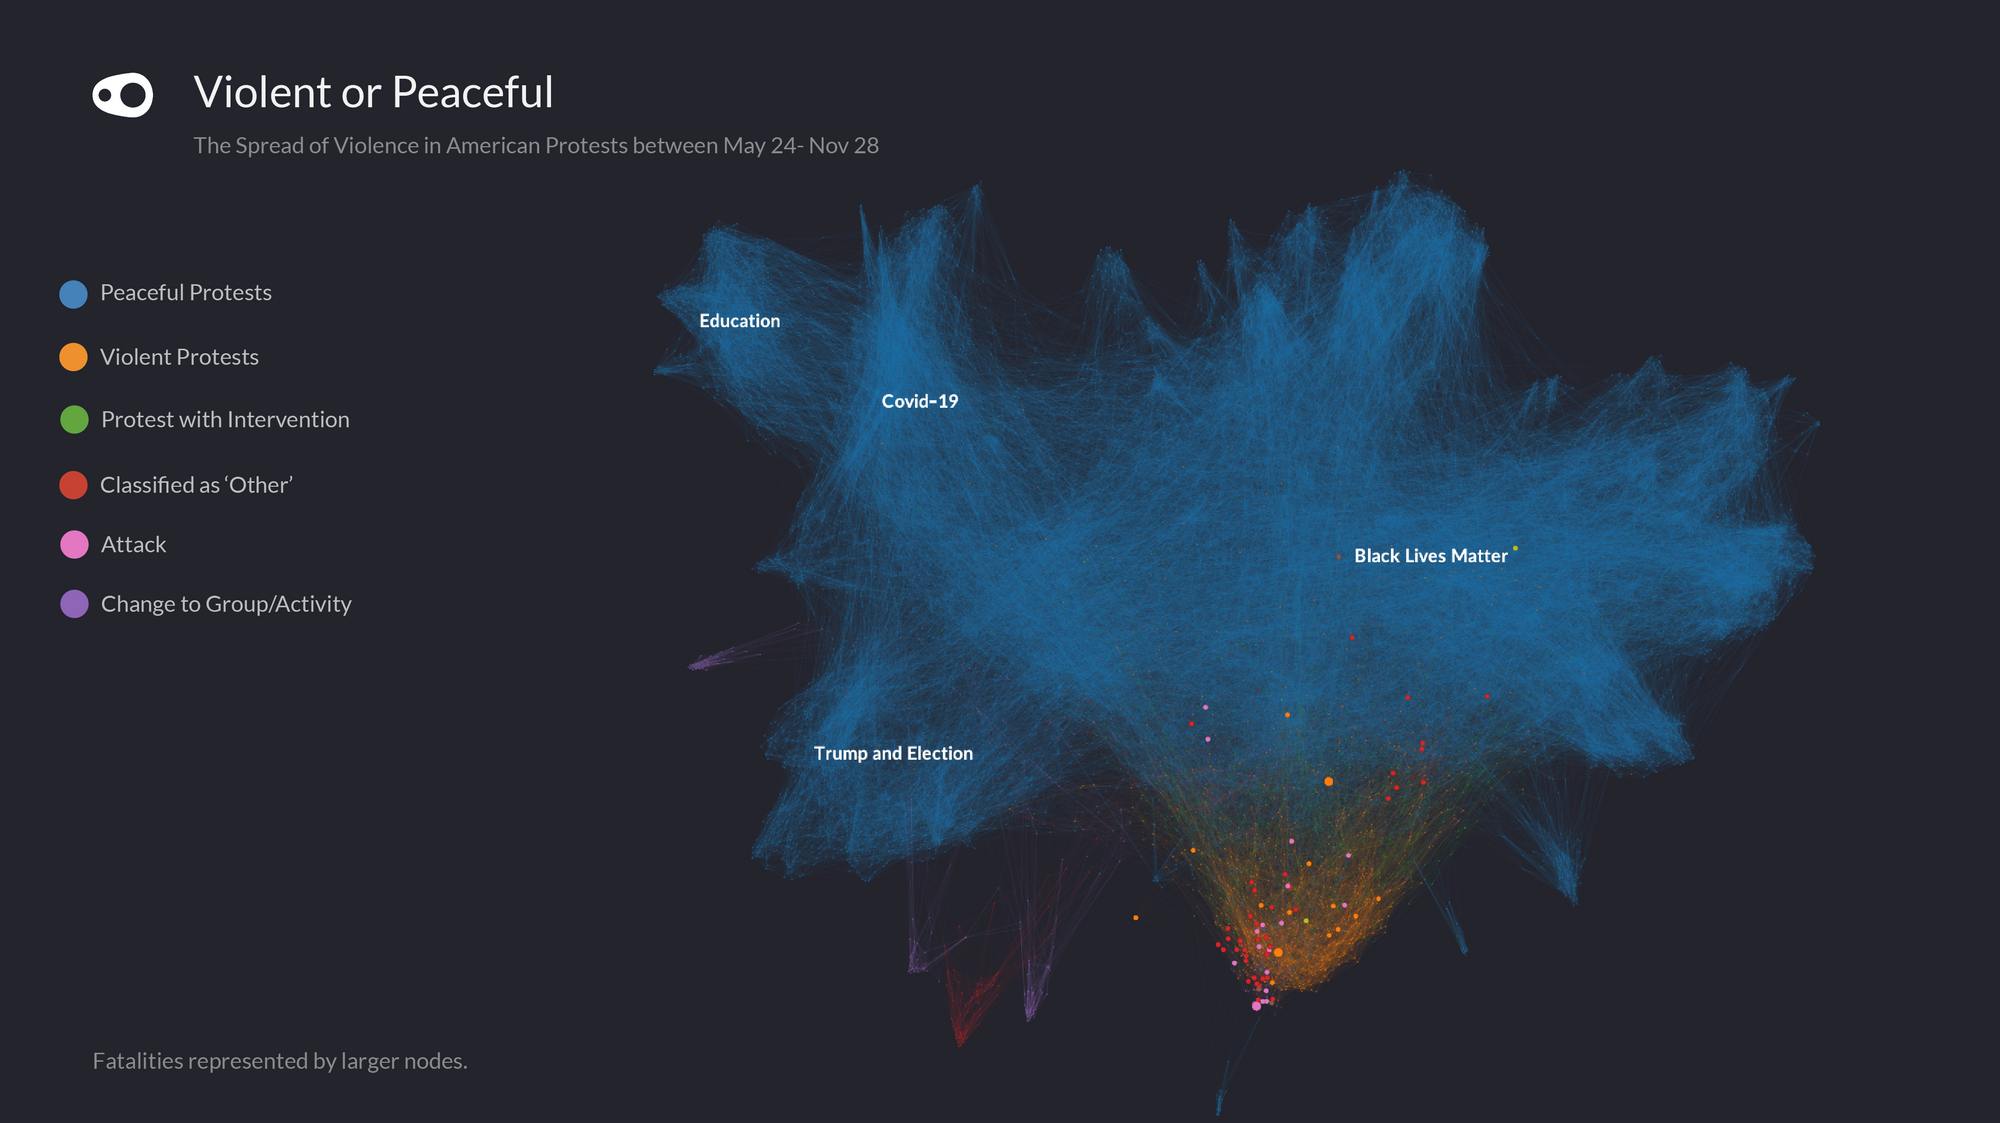
Graph: Events resulting in fatalities are represented by larger nodes on the Graph.
We visualised the trend of violent protests in Oregon and found that between June and September, the state saw an average of 5.3 violent demonstration events each week. Portland, Oregon, once hailed as one of the most livable cities in the USA was struck by a torrent of racial injustice protests throughout the summer. Often turning violent, these demonstrations are marked by vandalism and chaos as fireworks, bottles, rubber bullets and teargas were exchanged by protesters and police in scenes that appeared like war-zones.
A Hot Summer in Oregon
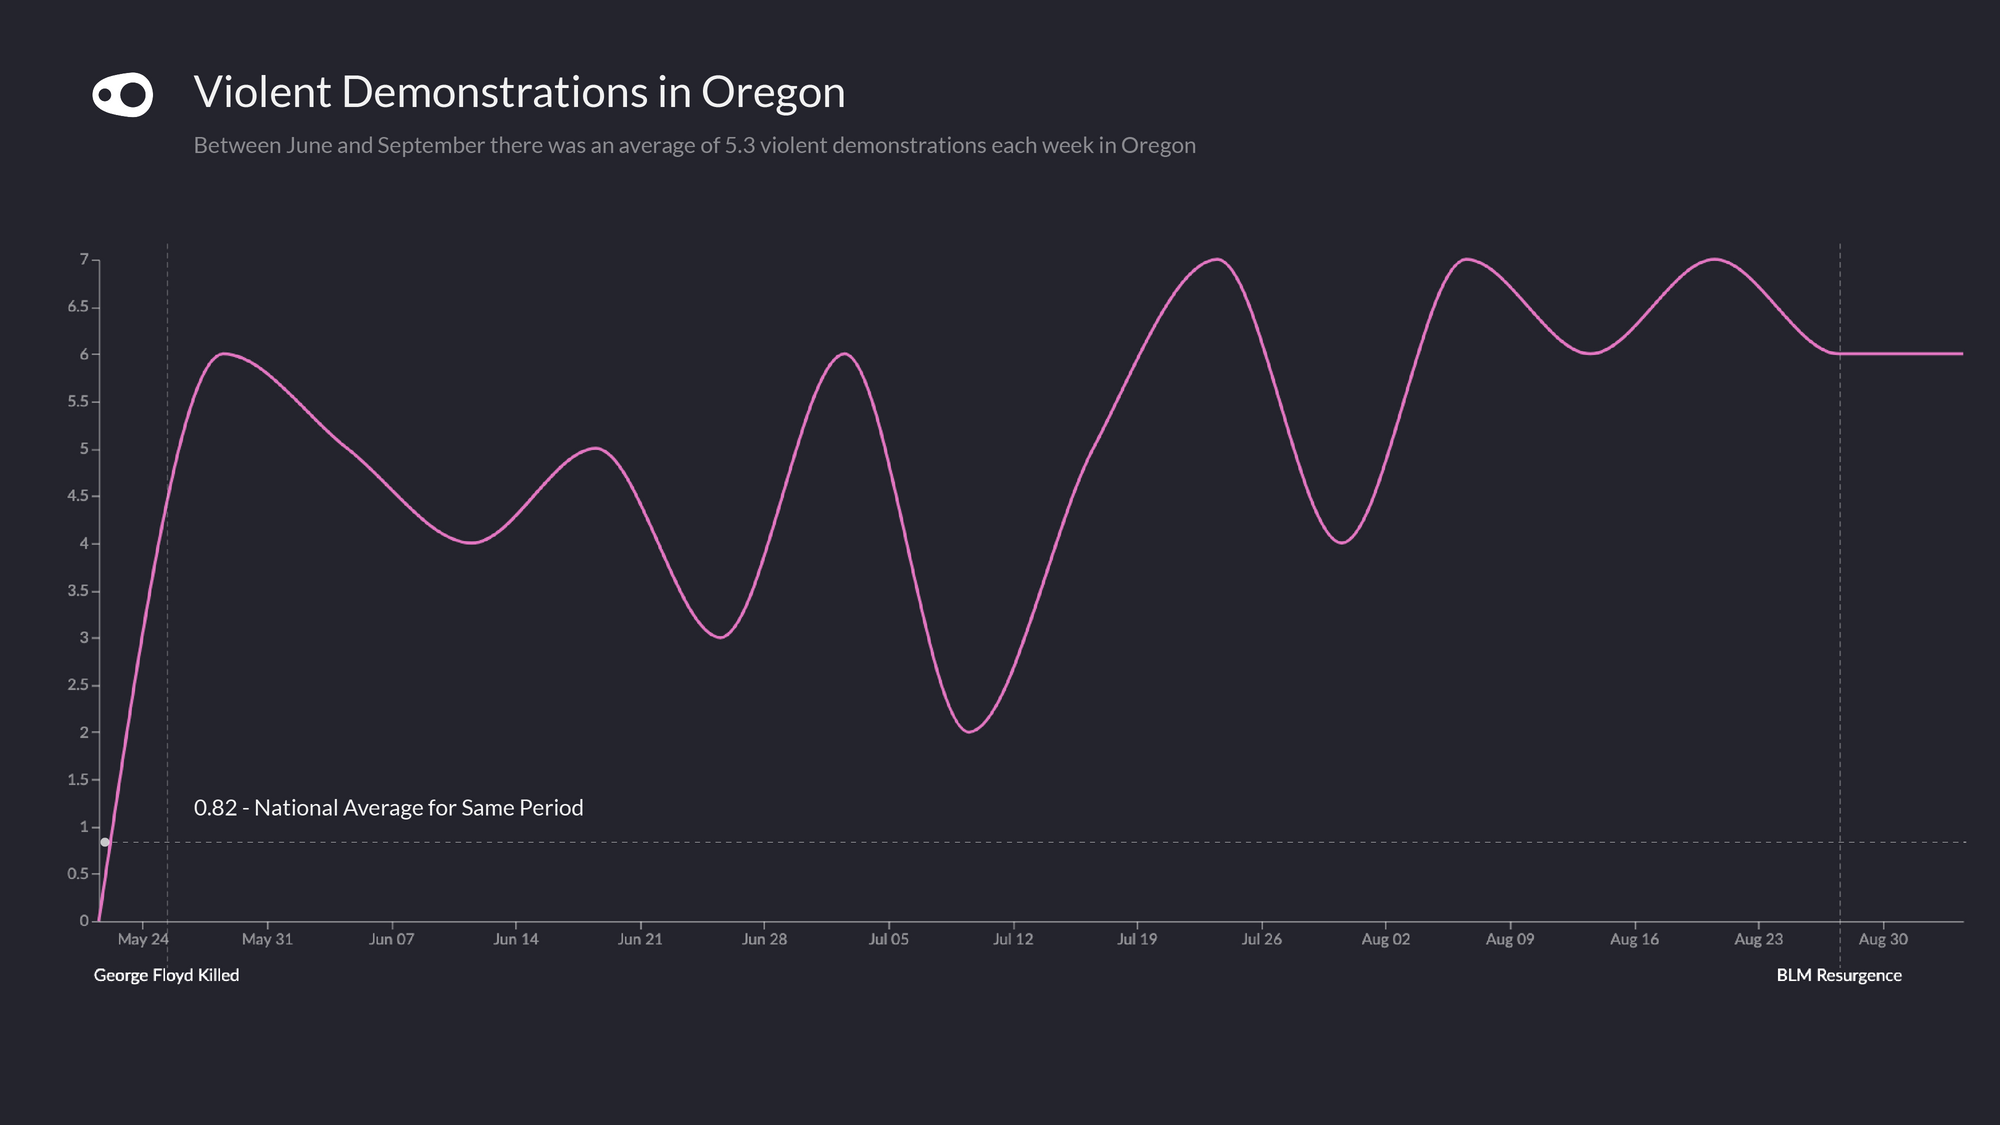
Trends: We annotated a trends chart to show how significant events affected the burst of violent demonstrations in Oregon this summer.
Zooming out on protest events using the Graph helped to understand how the landscape of demonstrations evolved in a tumultuous year for America. But with one incident triggering a movement that spread across the world, it was also important to zoom in on the data. To create our final insight for the project, we found the event that began the recent BLM movement in the USA.
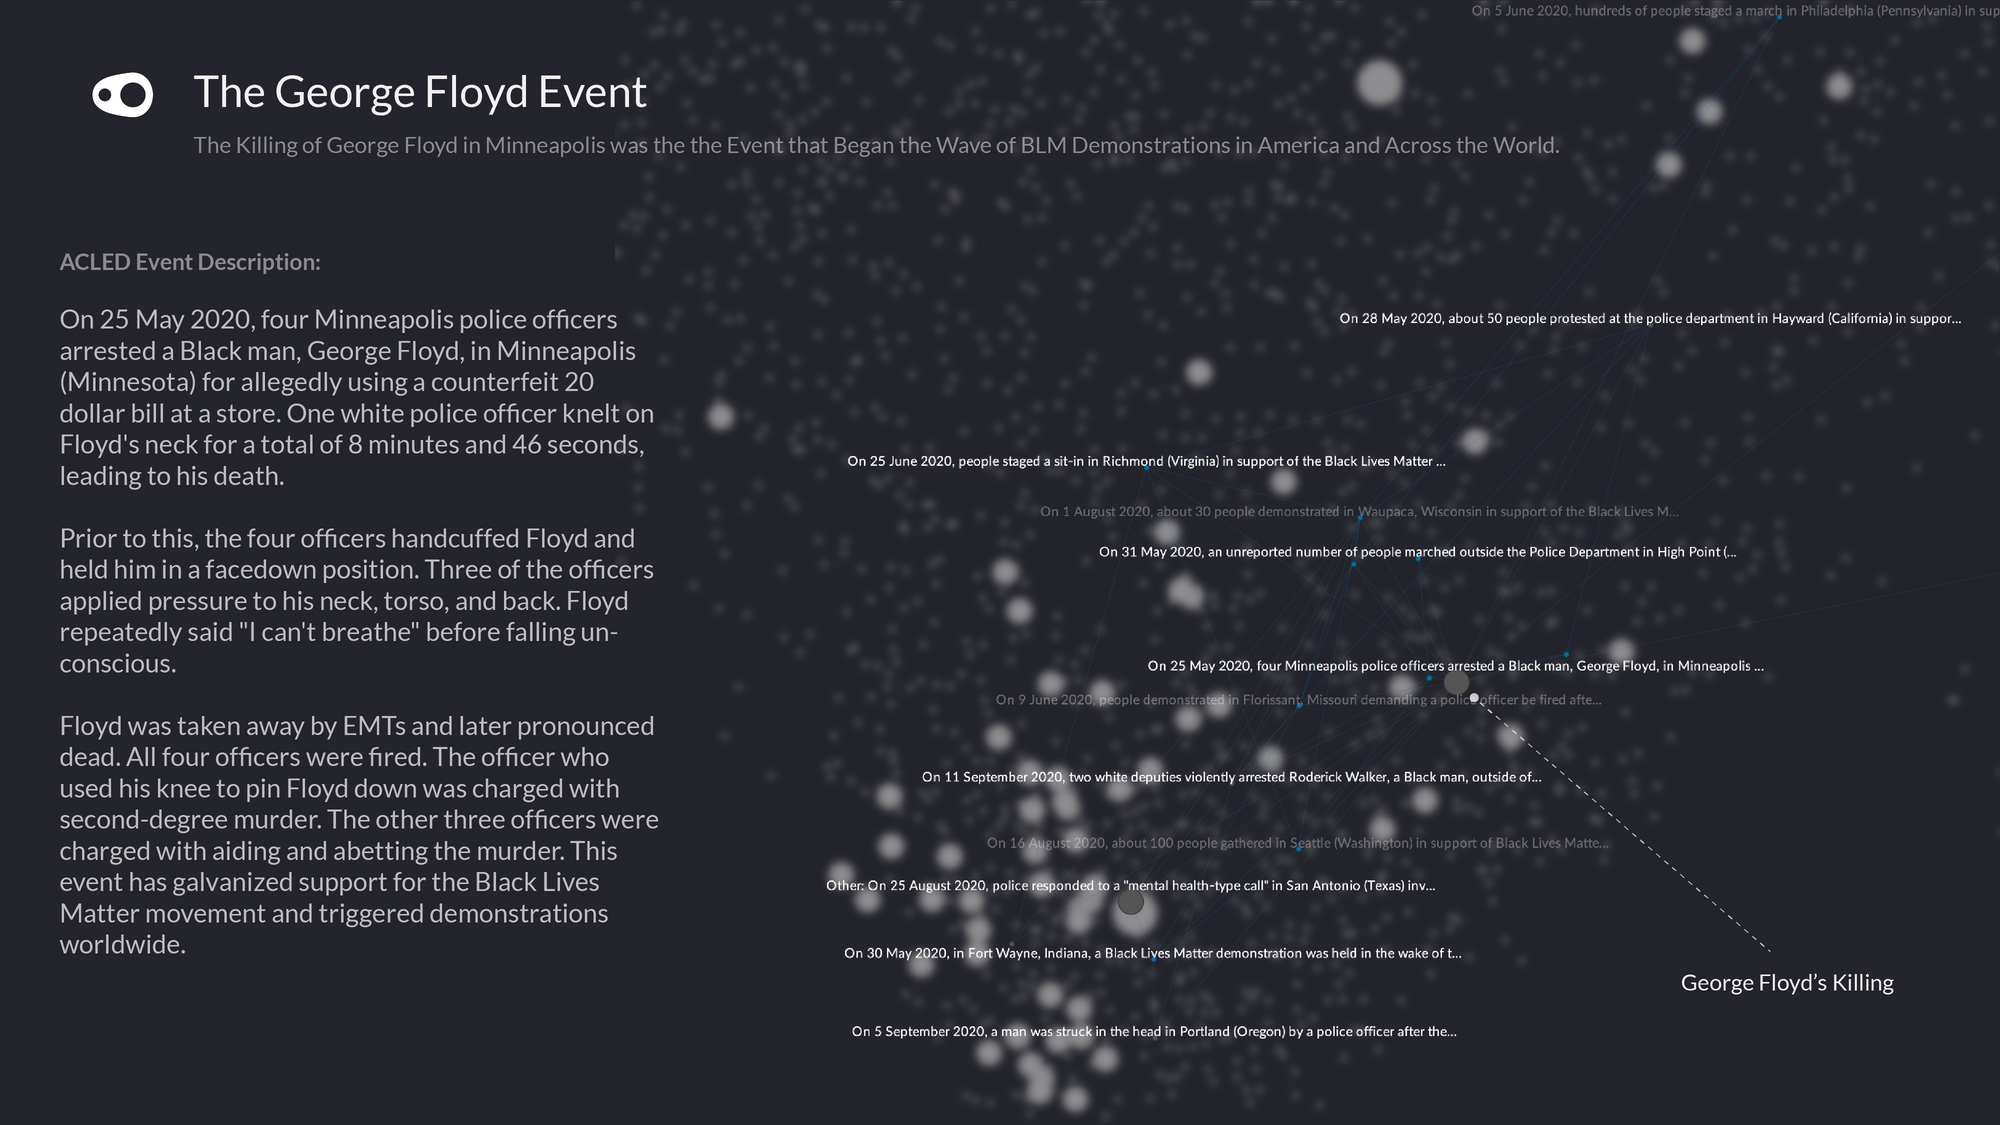
Insights and Graph: ACLED's description of the incident on May 25 where George Floyd was killed.