

Using Customer Data and RFM Analysis to Create Relevant Ad Campaigns
RFM analysis is a powerful market segmentation technique that can be used to group customers according to the recency, frequency and value of their purchases. Using data on geography, demographics and buying preferences, we set out to cluster a dataset of e-commerce customers and used the insights we found to suggest specific and relevant marketing strategies.
About 6 months ago I bought a coffee machine from one of the larger coffee companies and I immediately received an email telling me to sign up and receive £20 off my first order of over 100 coffee pods. Brilliant, I thought. I immediately ordered 100 pods directly from a premium supplier, received them and then set about drinking 100 cups of coffee.
Now, about once a month, I receive the exact same voucher to my email. This email I would now classify as spam. I am unable to make my first order again and would be paying full price. I am not one of these people that hates being targeted by ads, in fact, as someone working in data, I feel that it can be useful but only if done right.
Ads are fine providing that they are useful. Marketing efforts should focus on delivering customers with offers for relevant products or services.
Grouping all customers together in the same basket and offering them blanket deals and services does not make us feel looked after. It pesters and irritates us. Ignorance of this sits at the core of bad advertising. Making customers feel appreciated means appreciating their unique tastes and needs.
In the digital economy, marketers have extensive data on customers including their purchase history, page visits, income and campaign response patterns. Analysing RFM - recency, frequency, monetary value - allows you to cluster your customers, discover sub-communities and target them depending on their behaviour.
Making customers feel appreciated means appreciating their unique tastes and needs.
Segmenting Customers with RFM Analysis
Drafting in a dataset containing information about purchases made over 4 years by 1590 customers on an online superstore, our team wanted to demonstrate the usefulness of RFM analysis. To prepare the dataset for analysis we first aggregated the dataset so that each row represented one customer's purchase history. Then, we calculated recency, frequency and monetary value scores for each customer.
- Recency - the difference in time between the current date and the customer’s most recent transaction.
- Frequency - the sum of transactions made by the customer.
- Monetary Value - both a sum and a mean (two distinct variables) of the total amount that the customer has spent overall.
Normally this type of analysis would involve data analysis using a programming language like R or Python. Swiftly passing this opportunity by, we set the recency, frequency and monetary value variables using Graphext's built-in RFM analysis flow and executed the project.
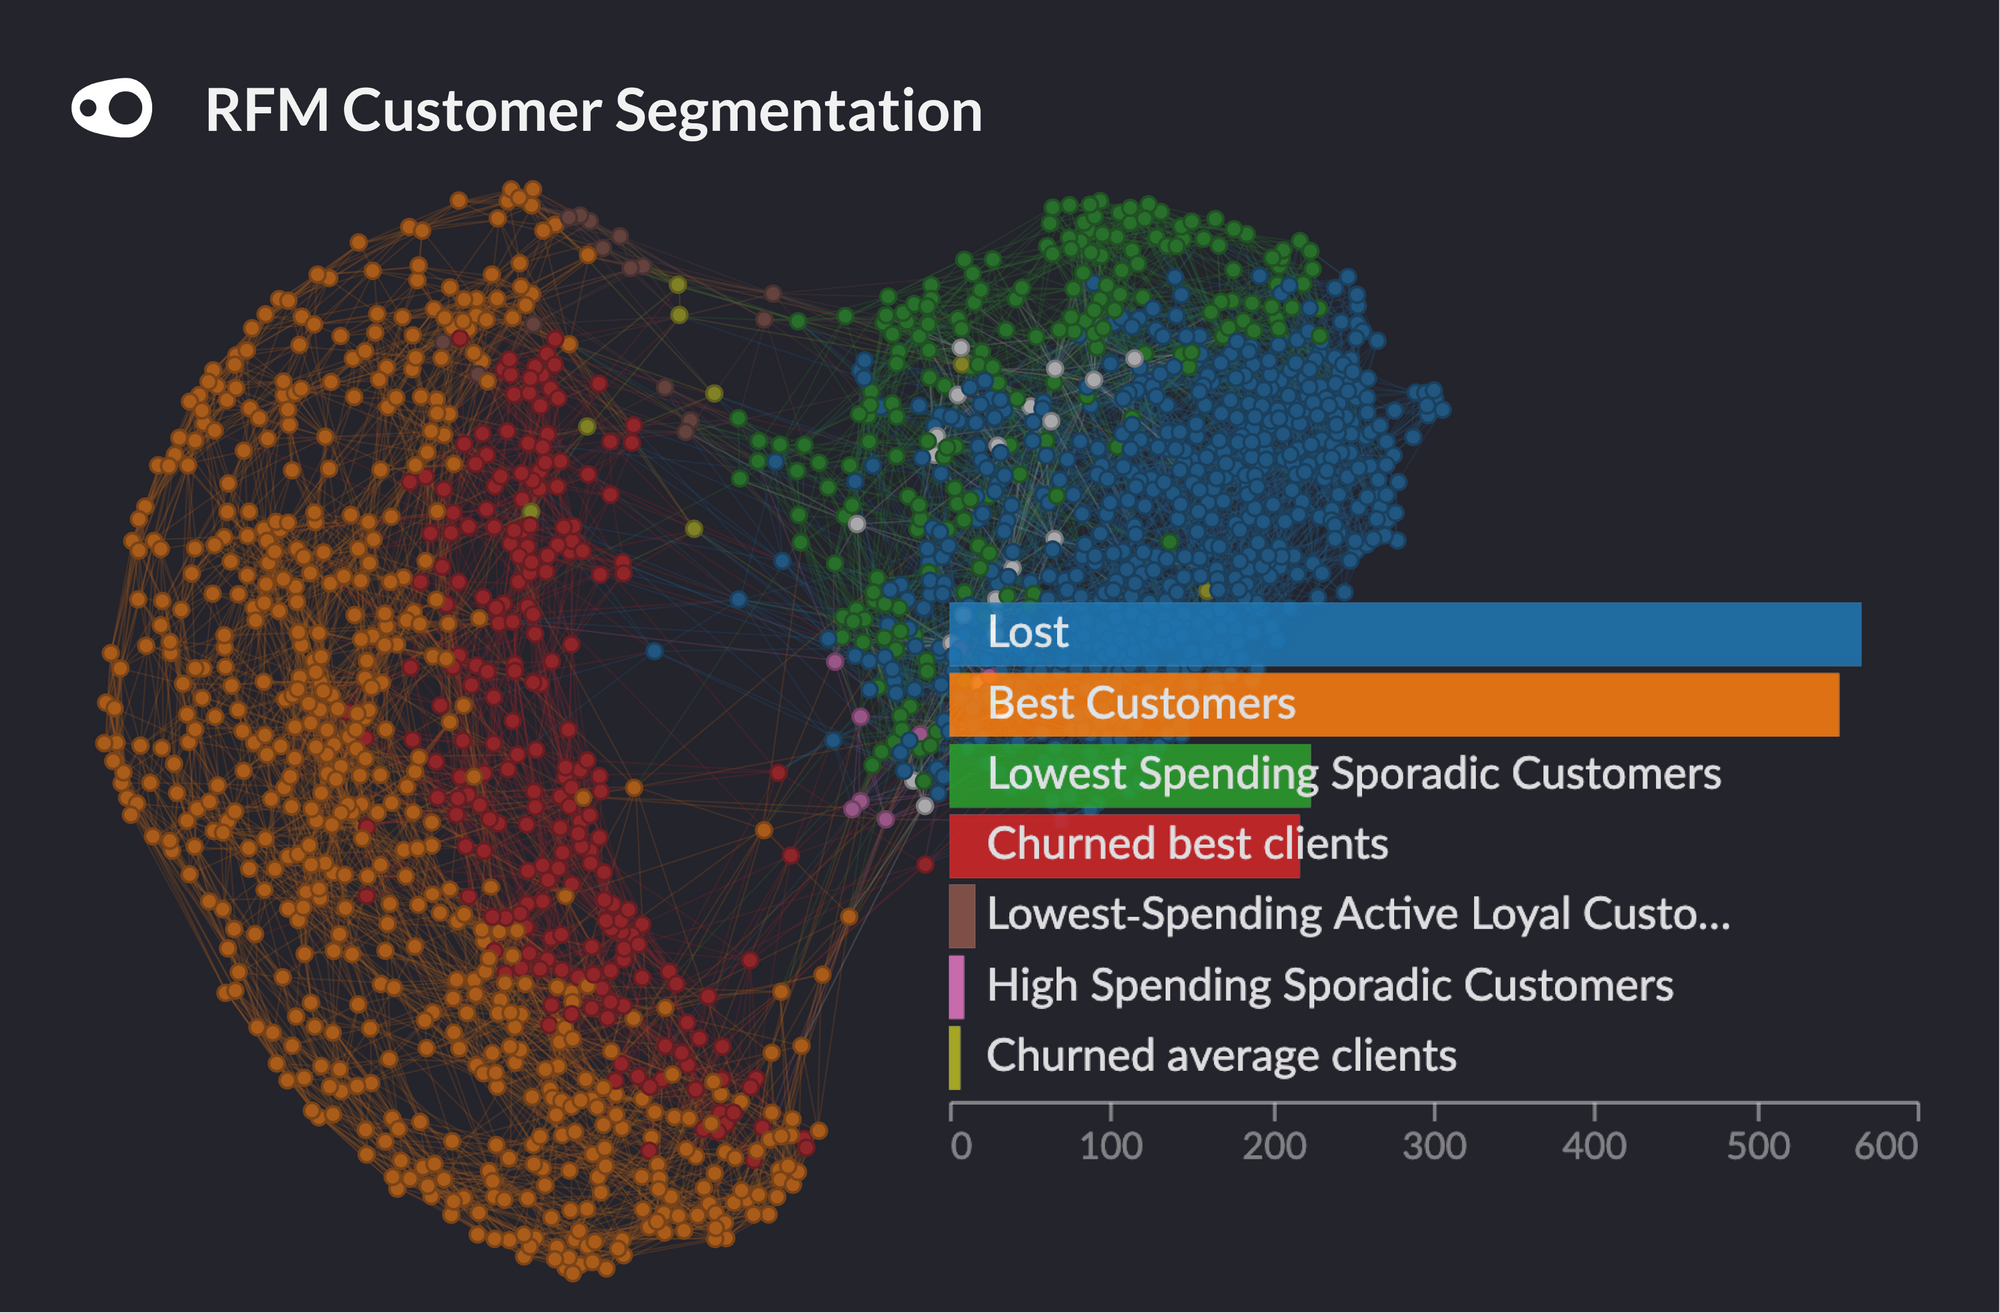
Graph: RFM customer segmentations.
The network visualization grouped better customers towards the bottom of the Graph. The lower a customer is on the network, the more they spent.
Identifying a 'Best Customer' Community
Diving straight into the analysis, our first move was to segment customers according to their recency, frequency and monetary value metrics. For instance, Lost customers are ones with a low recency score and Best Customers represents the group of customers with the highest frequency and monetary value.
A striking revelation made by our team was the finding that people inside the cluster of Best Customers are generally surrounded by good customers that end up churning. Despite being regular customers, the data shows that these people churn and could be unsatisfied in some way. In order to avoid churn, they should be analysed in more detail so that specific and appropriate action can be taken.
Gentle reminders to regular customers that have churned would be an informed and relevant campaign strategy.
For customers inside of the Best Customer cluster, it looks to be important to maintain regular offers as it seems to be very easy to lose them to churn. Additionally, the Churned best clients cluster might be easily brought back by good promotions sent to their email. They were previously loyal and it's likely that their loyalty could return with some gentle reminders.
Geographic Segmentation with RFM Analysis
A quick comparison of the clusters revealed that the majority of the online superstore's best customers came from the USA and mainly bought office supply items. Boosting the number of office supply deals to these customers is a straightforward and sensible way of boosting sales.
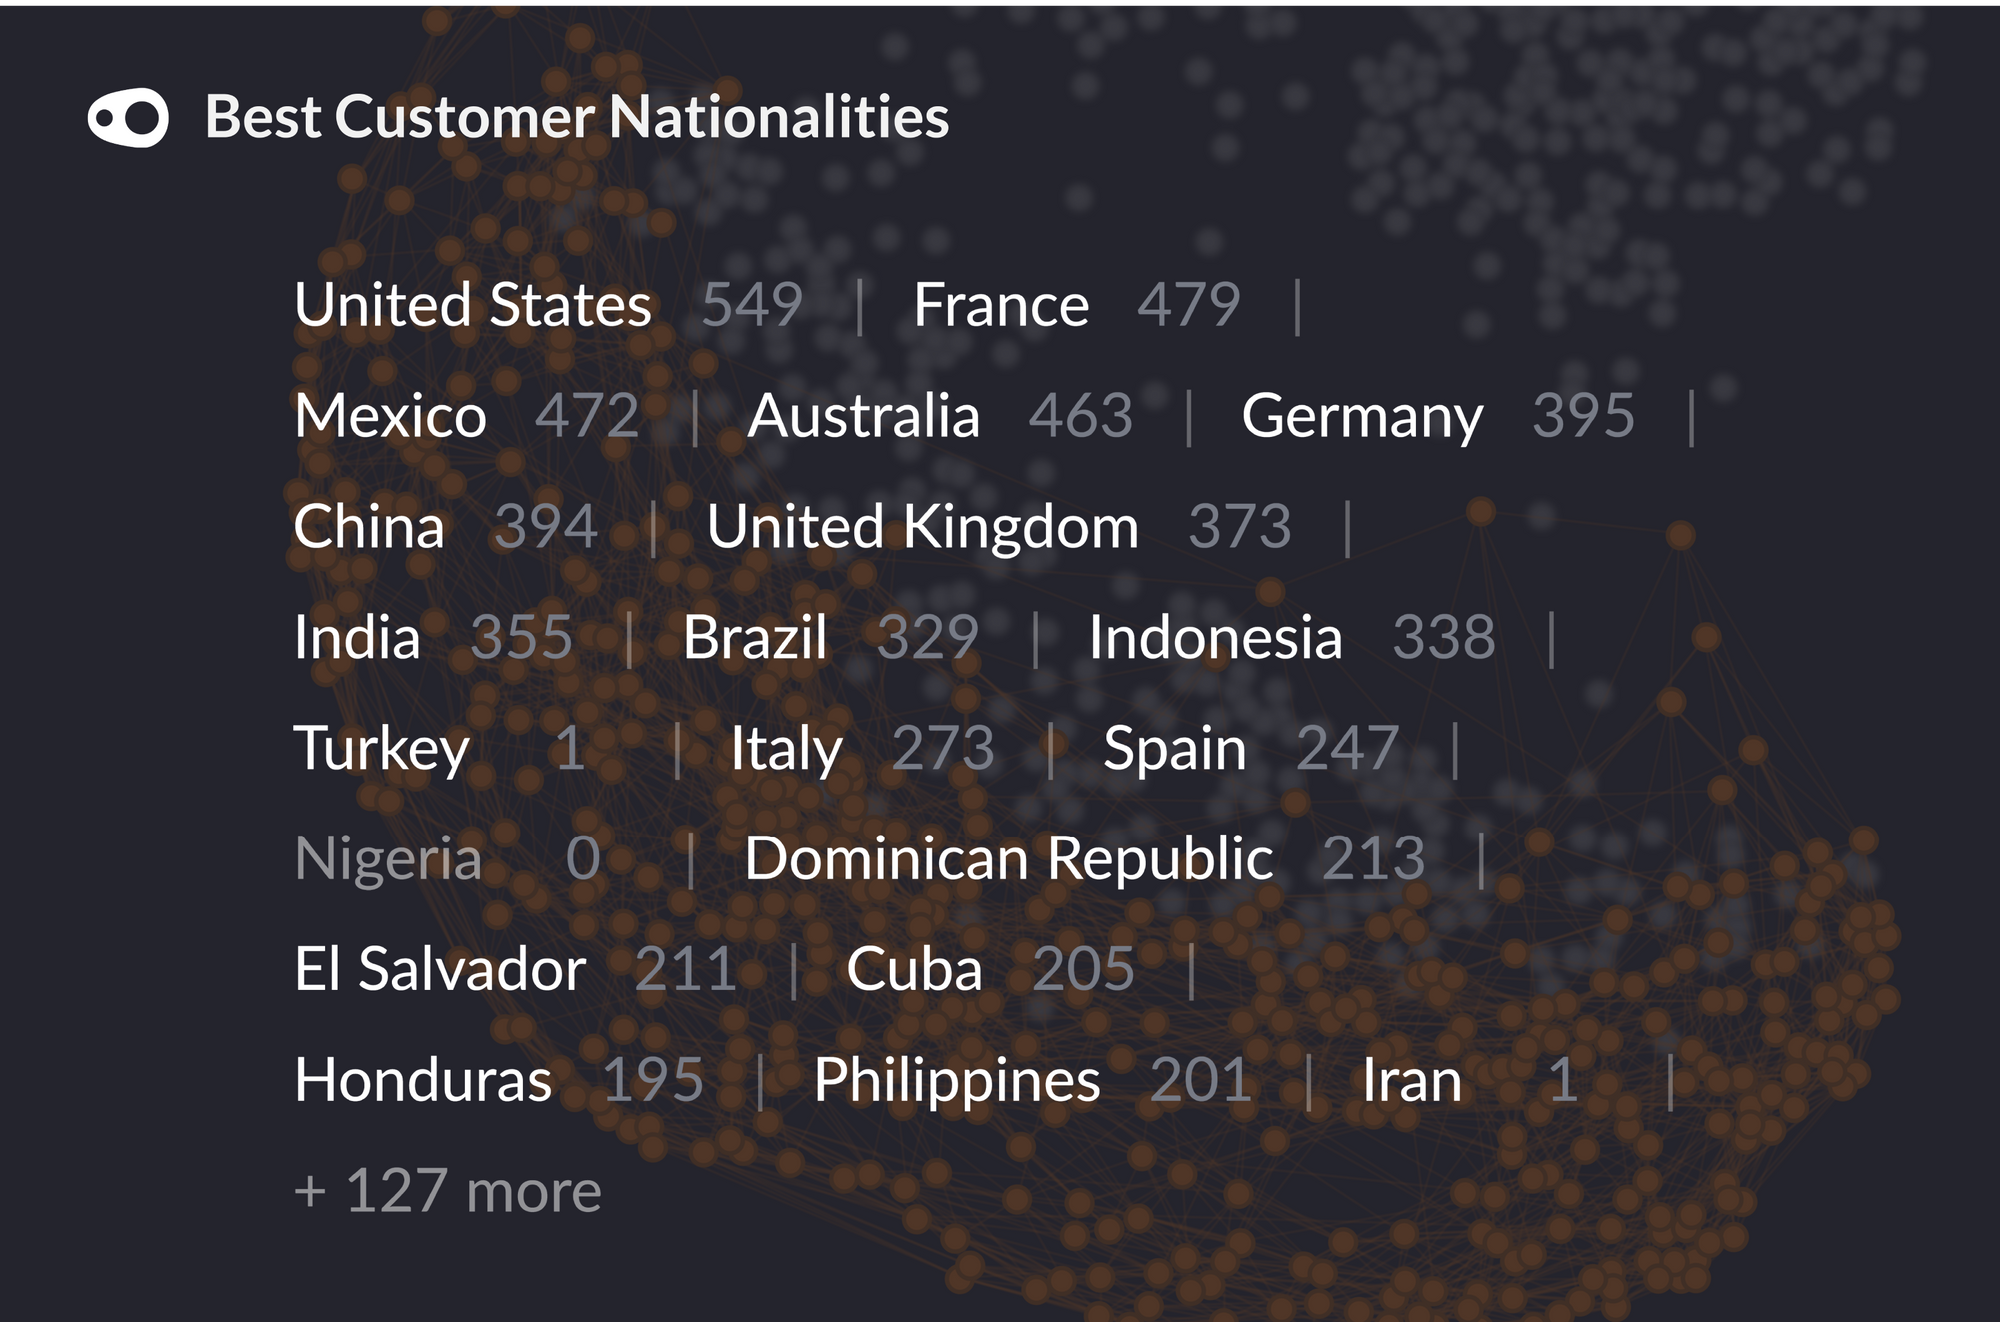
Graph: Nations where customers in our 'Best Customer' market segment originate from.
Focusing on the campaign strategies moving forward, our team hypothesised that a marketing campaign in a country such as the UK, Brazil or Spain, would be beneficial. Comparing the countries of origin of our Best Customer segmentation signified that these nations already have a number of valued customers.
In the context of an advertisement campaign, it would be wise to target nations already showing engagement in the hope of increasing their share of valued customers. This kind of informed campaign strategy is much more likely to return positive results when compared with an uninformed strategy targeting less engaged nations like Canada.
Timing Effective Marketing Efforts
Lastly, it's important to note that some loyal customers don't spend that much on their purchases. For this group, an informed decision to create a targeted promotion campaign encouraging them to buy more might increase sales volume. Promotions could be launched on Fridays since this is when they are typically making the most purchases. Taking into account the type of products that they usually buy would help to further customize these promotions.
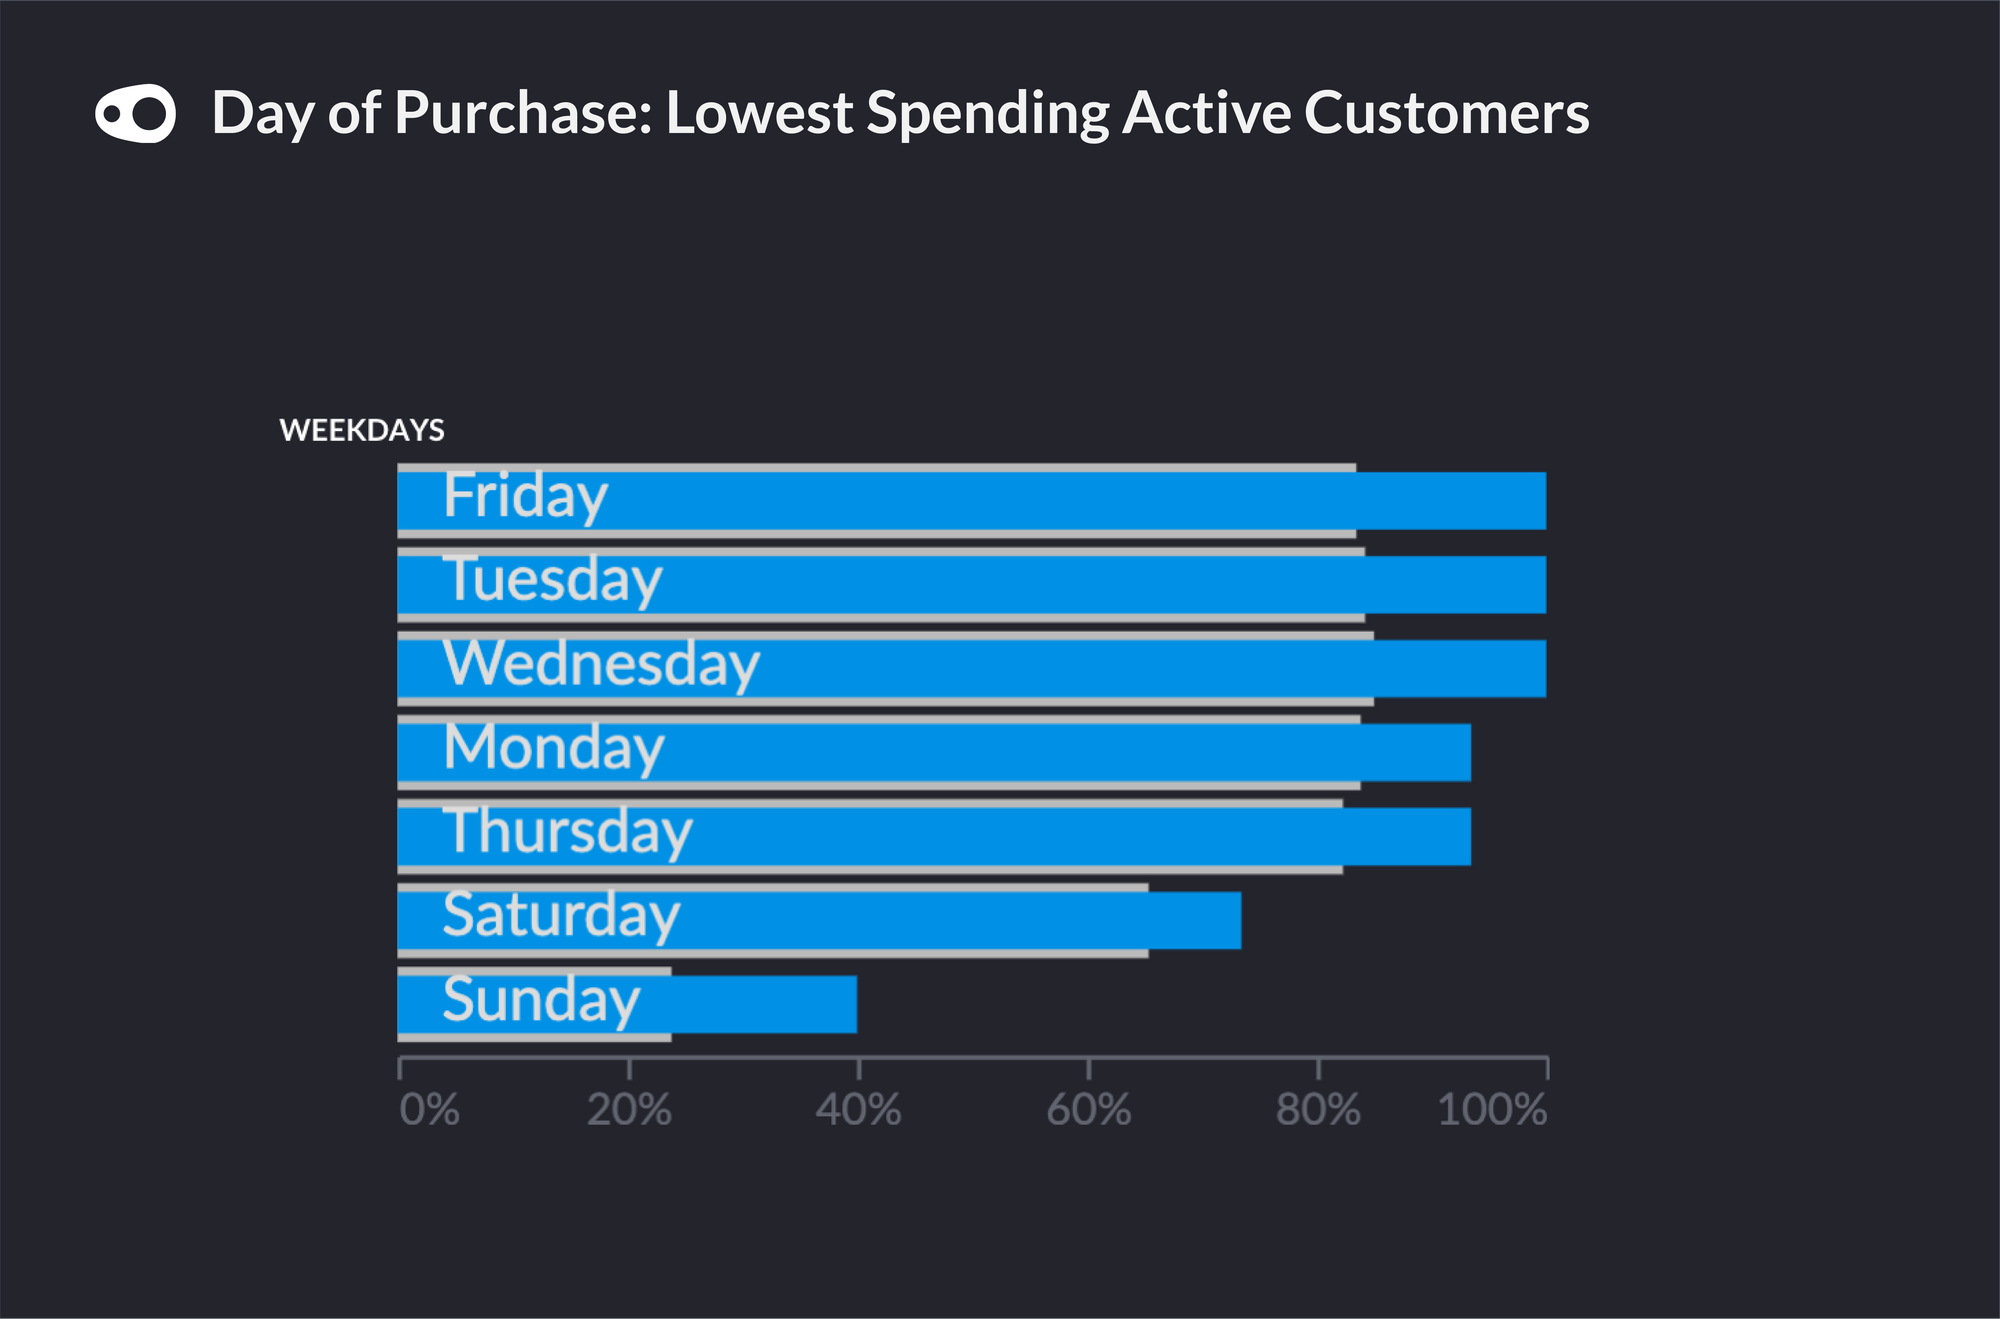
Sidebar Chart: Day of the week where lowest spending active customers usually purchase.
The more companies understand - and more importantly - learn about their customers, the better. They should account for their distinct tastes, preferences and attitudes as well as discovering how they are behaving in relation to products and platforms where they are bought. Data and RFM analysis can help companies achieve this. Developing a robust method of processing, transforming and analyzing customer data means that companies will retain their best customers, gain new ones and boost their profits.