
Zara vs. Gap: An Instagram Analysis
A few weeks ago, news emerged about Inditex launching its brand Pull & Bear in the US. The move underlined its ambitions of becoming the world’s first fully global apparel company. In the US, it has already overtaken the local favorite Gap Inc. by revenue years ago to much fanfare.
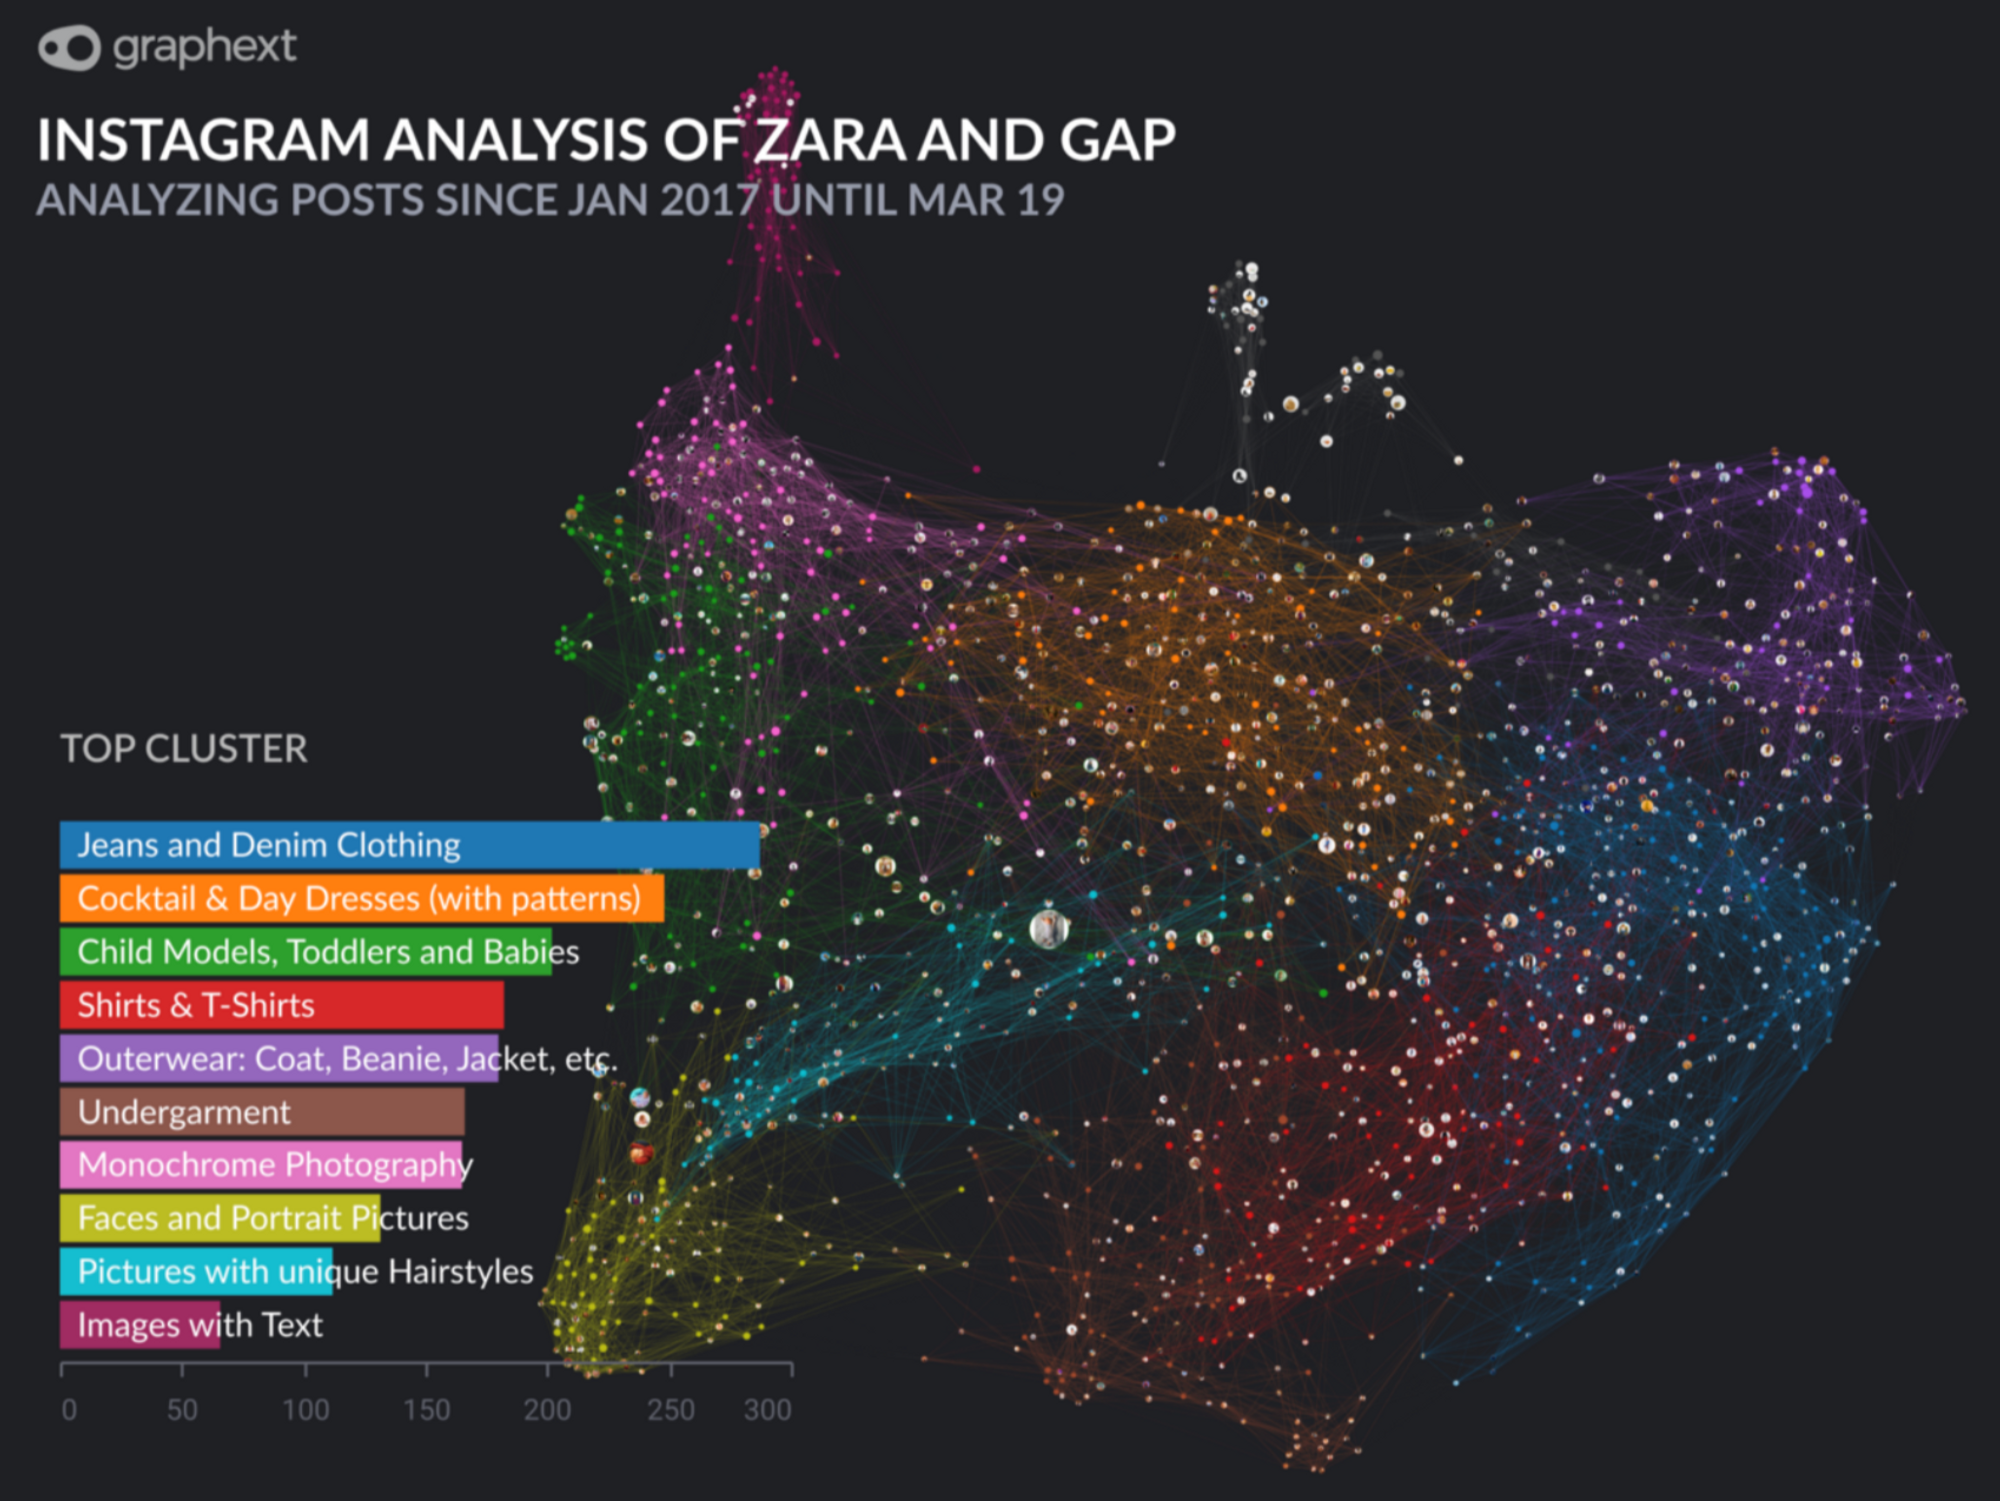
Beyond financials, Graphext helps analysts to look behind the curtain. What are the unexpected insights and surprising patterns contained within the social media strategies of Inditex’s flagship Zara and Gap clothing businesses? In this issue we analyzed the Instagram posts of both retailers since January 2017 - a dataset of almost 2000 social media posts and images. Graphext's built-in algorithm constructs a network representation of the data - each node capturing an image that either Zara or Gap posted during that time period. Similar images are connected to each other. Images with many connections among each other form a colored cluster. To extract image content and other metadata, Google Cloud Vision is automatically queried for each post to generate more variables and help further our analysis.
The biggest cluster shows us pictures with Jeans and Denim Clothing and consists of more than 250 posts. The smallest one, with around 60 images, holds Images with Text. Graphext generated this categorization automatically using the available metadata and allowing for more detailed manual exploration. The clusters give us already a first interesting insight, but what really matters is to find out what differentiates the two brands. To analyze that, we could simply filter on the Brand variable and compare the statistical distribution with that of the full dataset.
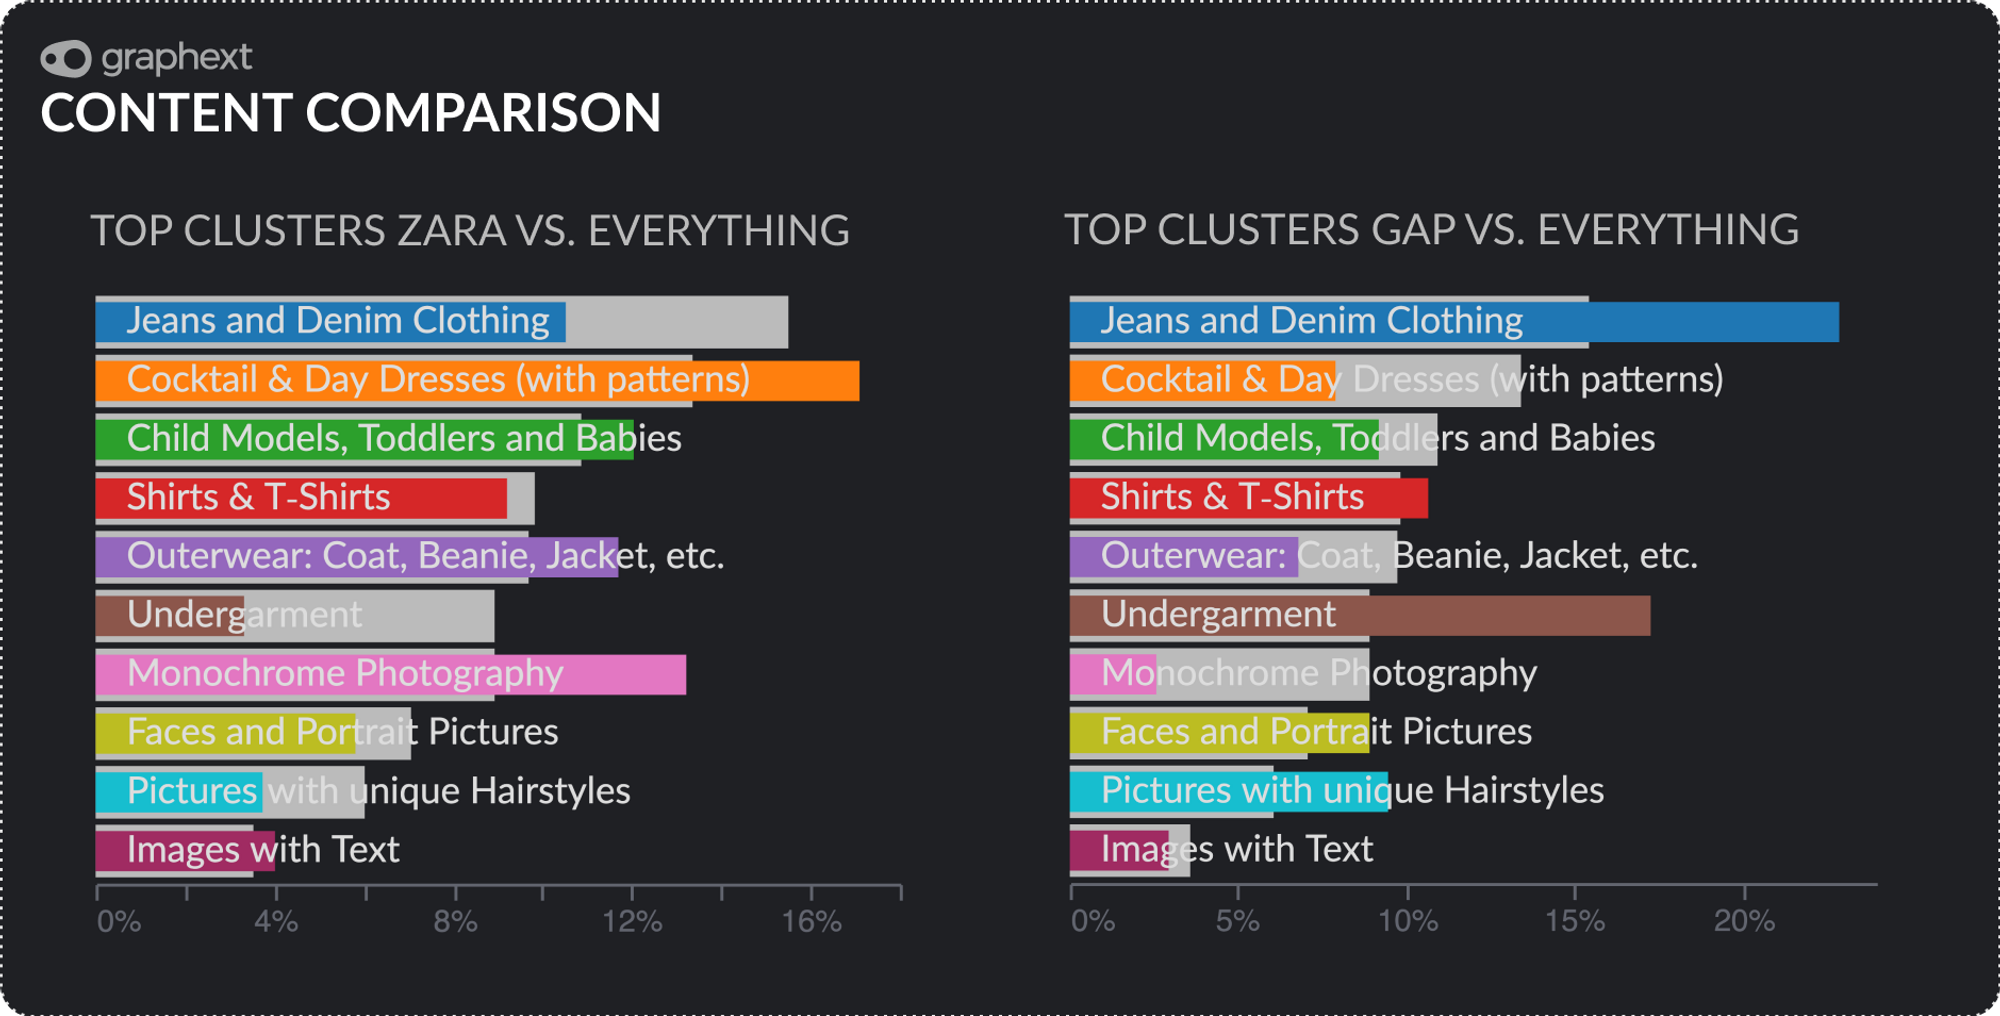
We can gather many insights by comparing the two charts. Zara, for example, has many posts about Cocktail & Day Dresses, Child Models, Toddlers and Babies, Outerwear, Monochrome Photography and Images with Text. Gap’s posts, on the other side, are more often about the Jeans and Denim Clothing category (their staple), Shirts & T-Shirts, Undergarment, Faces and Portrait Pictures and Pictures with unique Hairstyles.
Brand Specific Content
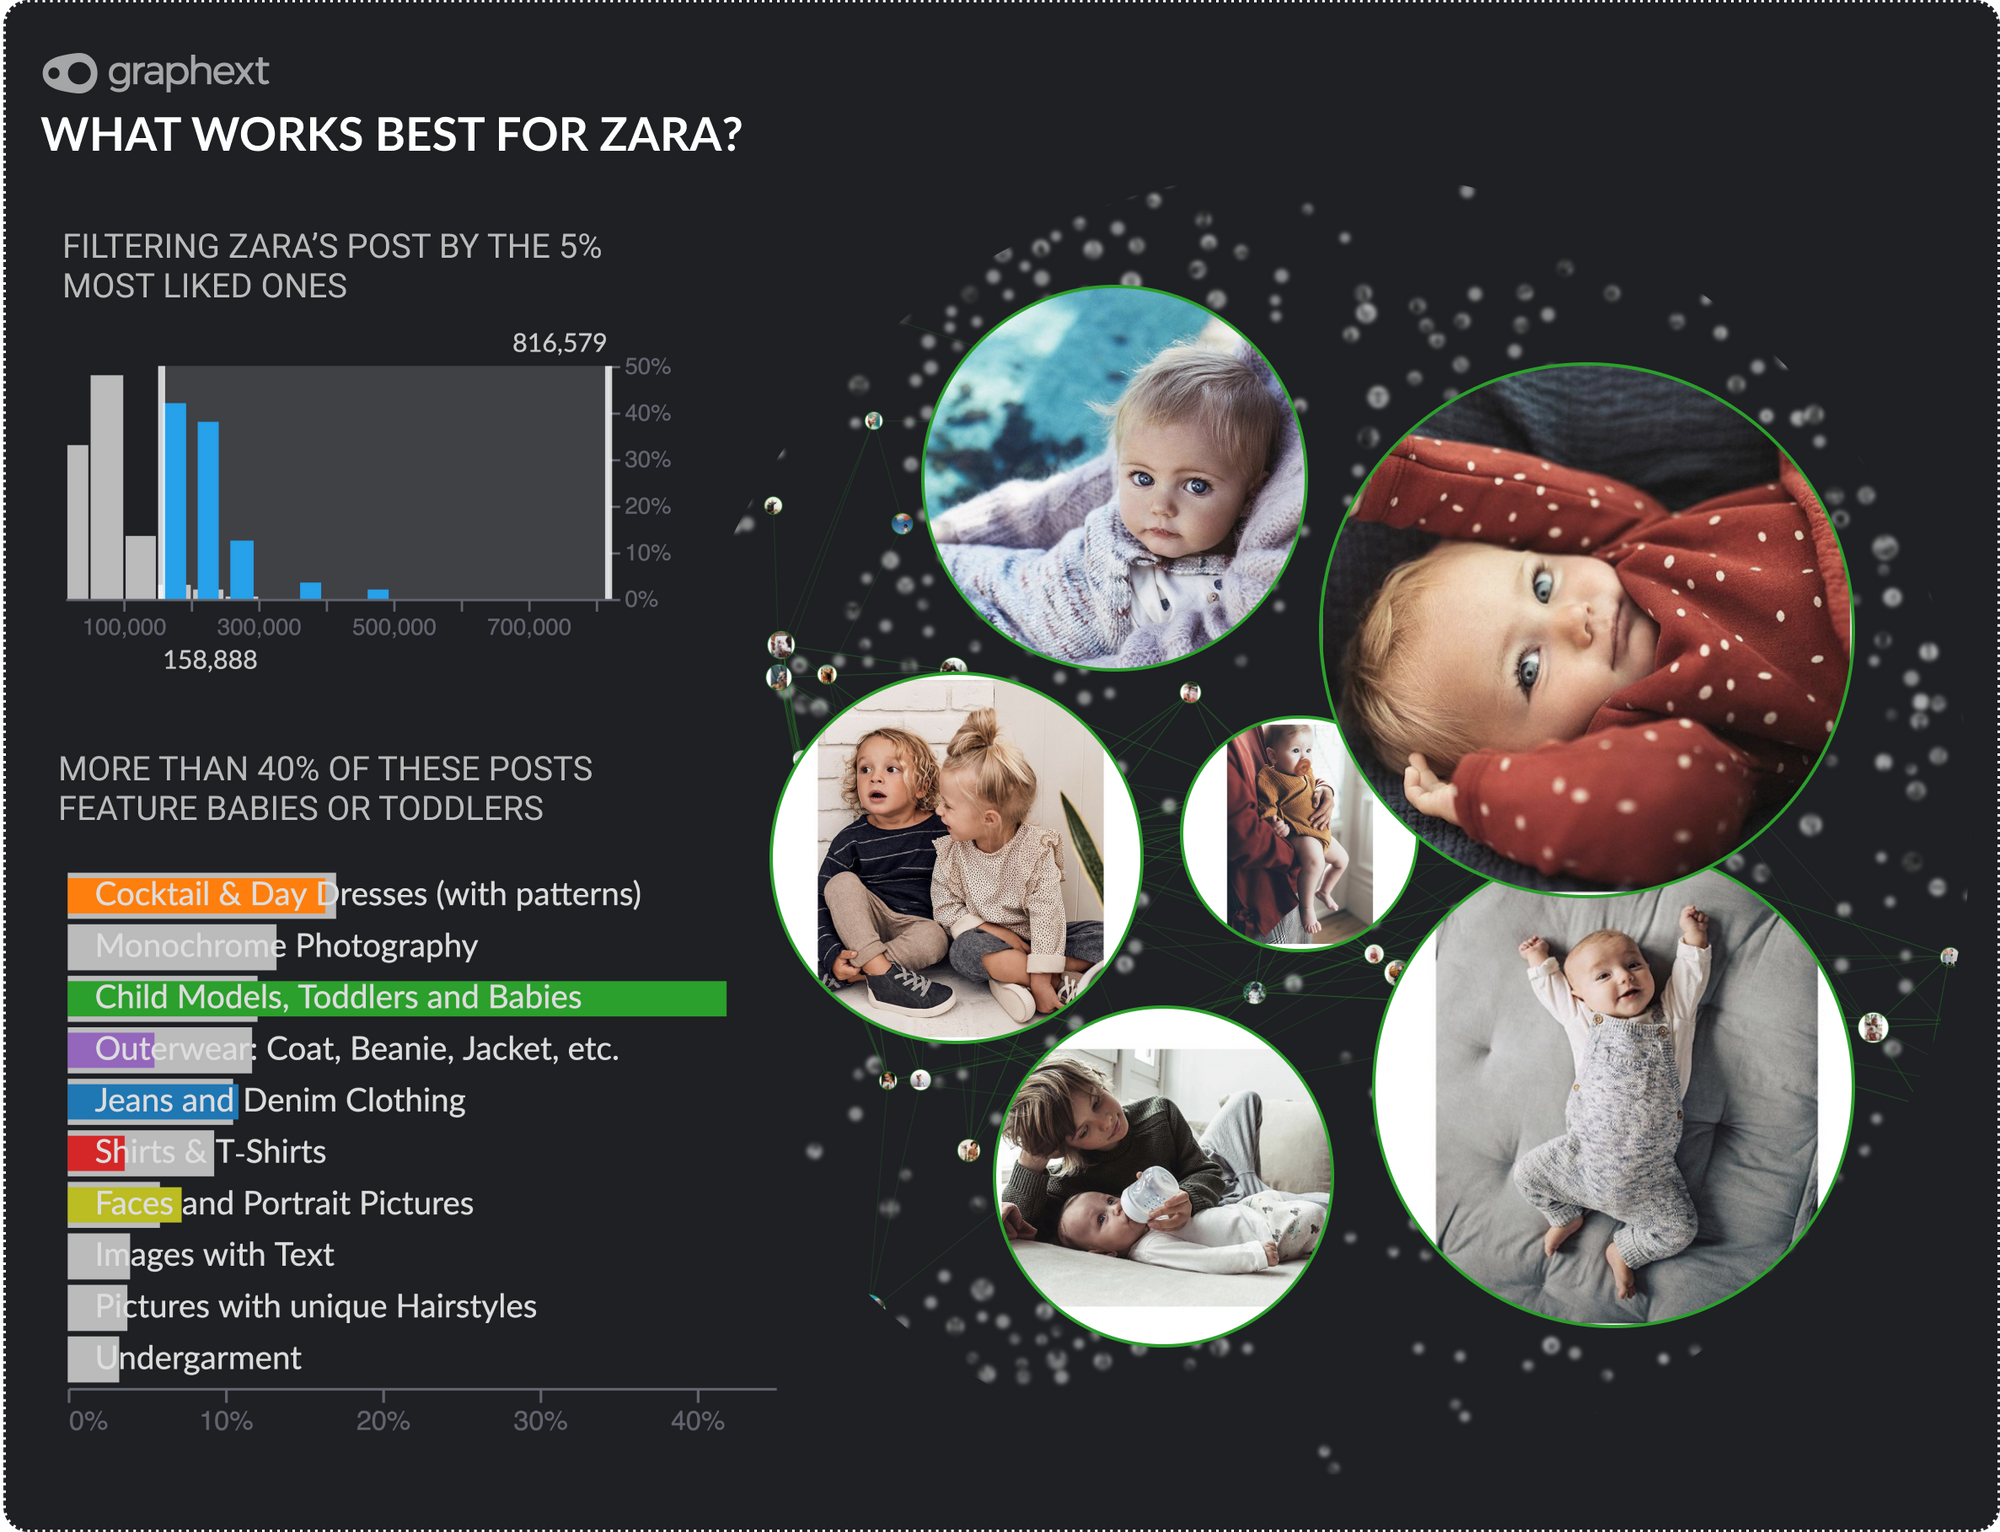
Besides figuring out what brand creates what type of content, Graphext can also extract insights about what content works better for each of them. To compare each content independently in the same project we first filter by Brand and then drill down within our project. By filtering the top 5% liked posts, we encounter the single most important cluster for the selection of Zara’s posts: Child Models, Toddlers and Babies.
If we do the same for Gap, we see that the two main clusters are Jeans and Denim Clothing and Undergarment which are making up more than half of the most successful posts. We can say that this is Gap’s best working content.
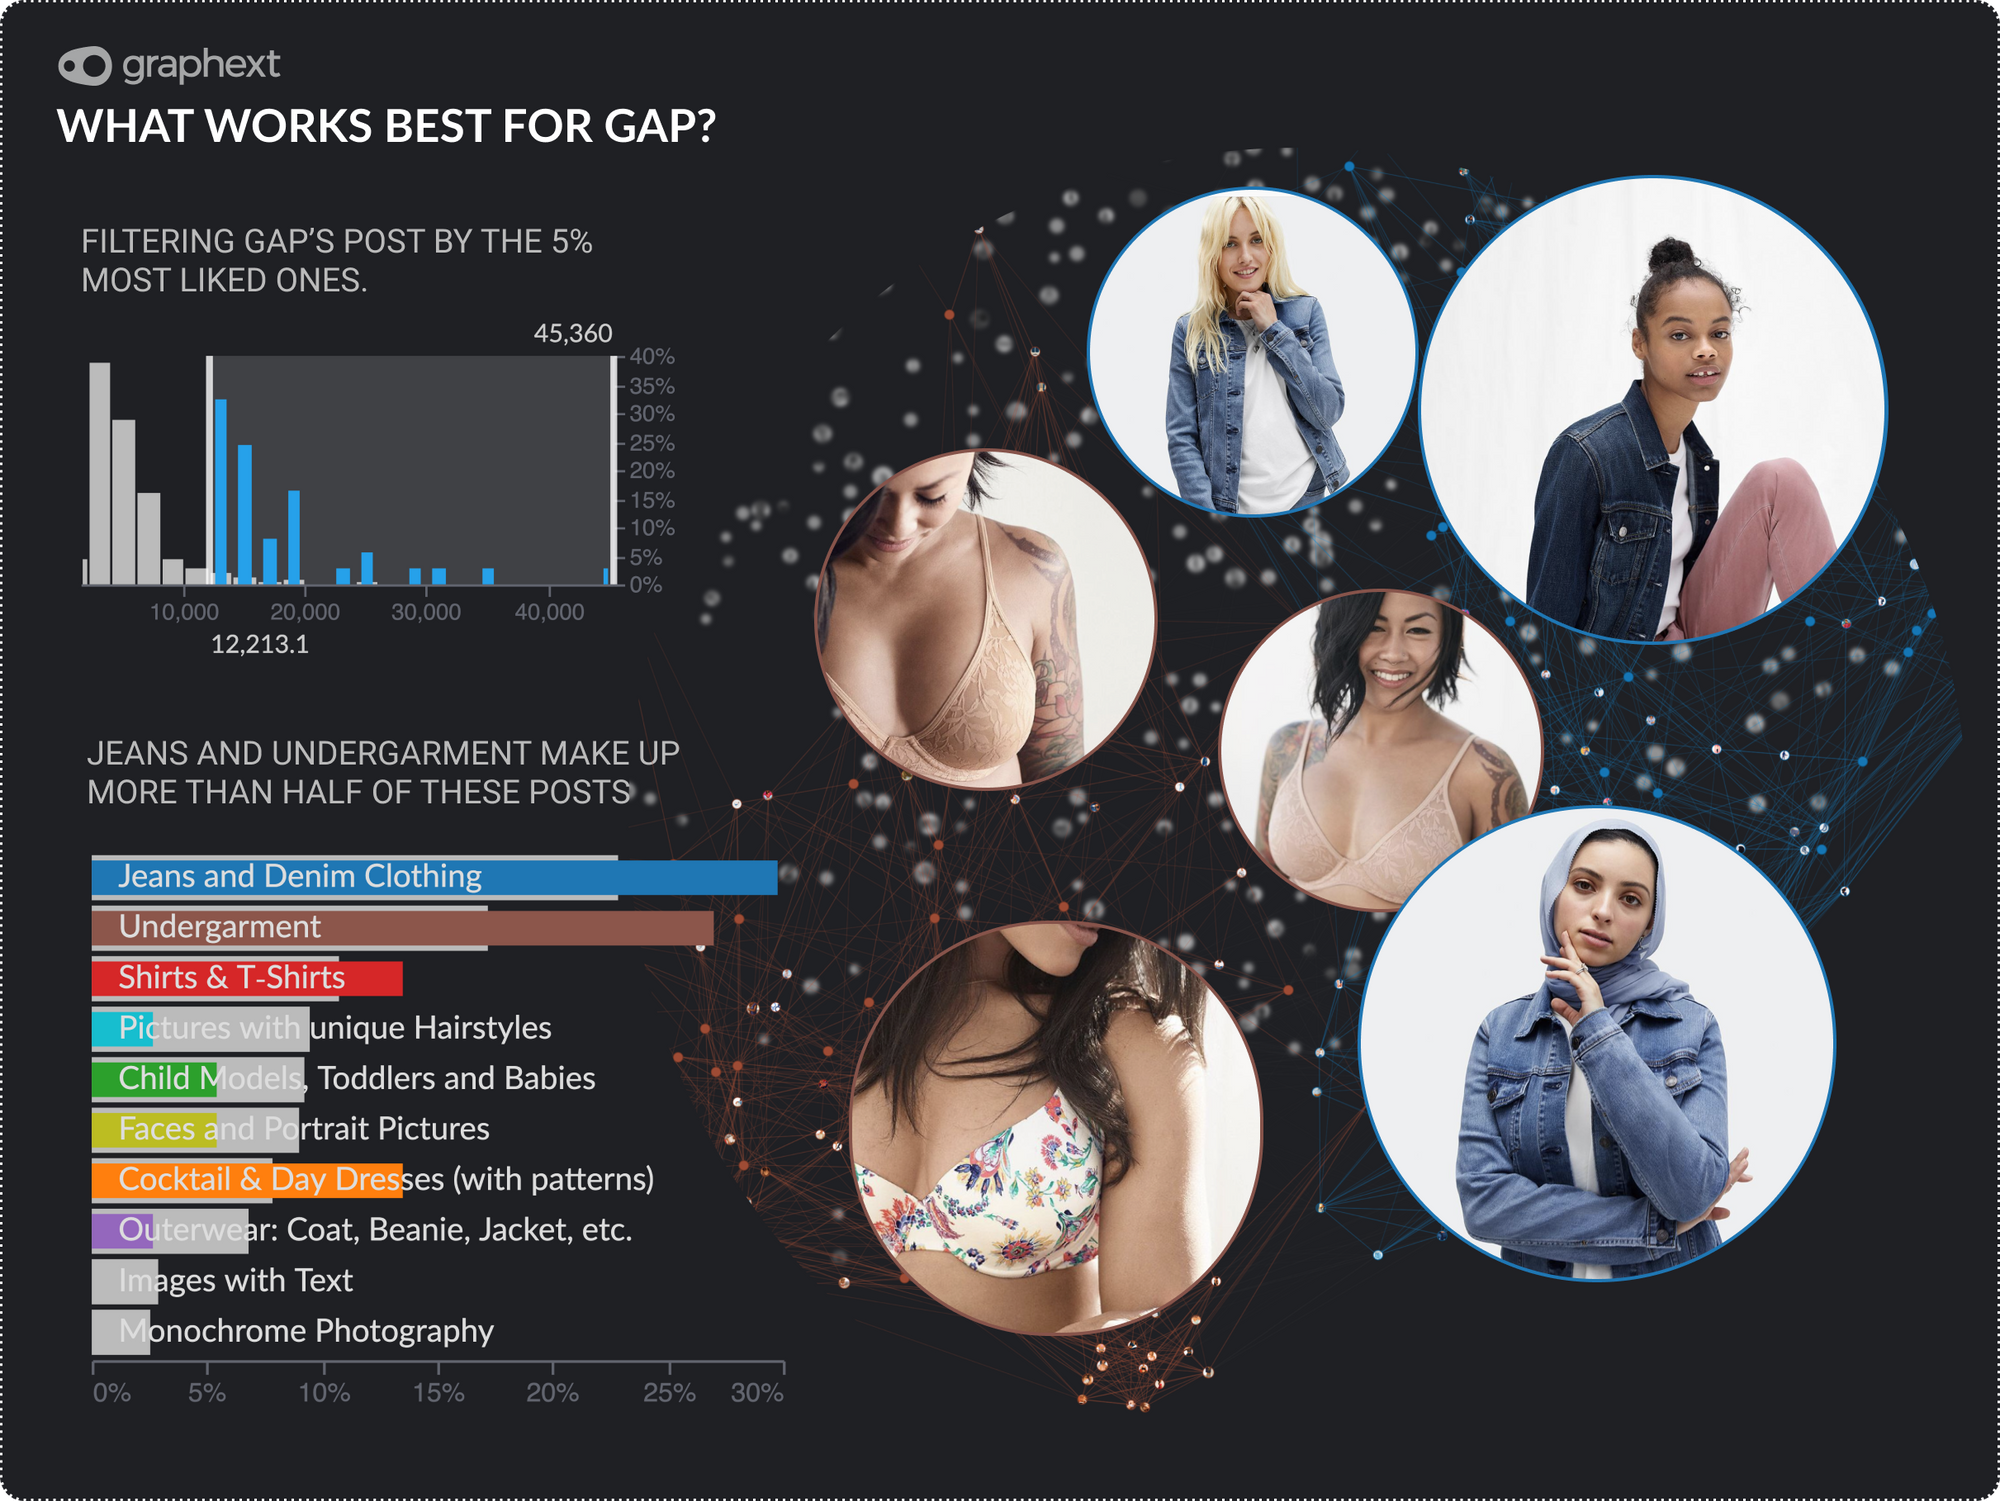
As you can see, there are some very clear differences between the Instagram strategies of Zara and Gap. Of course, there are more sources to consider if you want to properly analyze the reputation and success of both brands. For example, the news coverage of both brands, their Twitter fanbases or Instagram Hashtags. There will be many more analysis around these topics here on our blog.