March 18, 2025
🌟 New Features
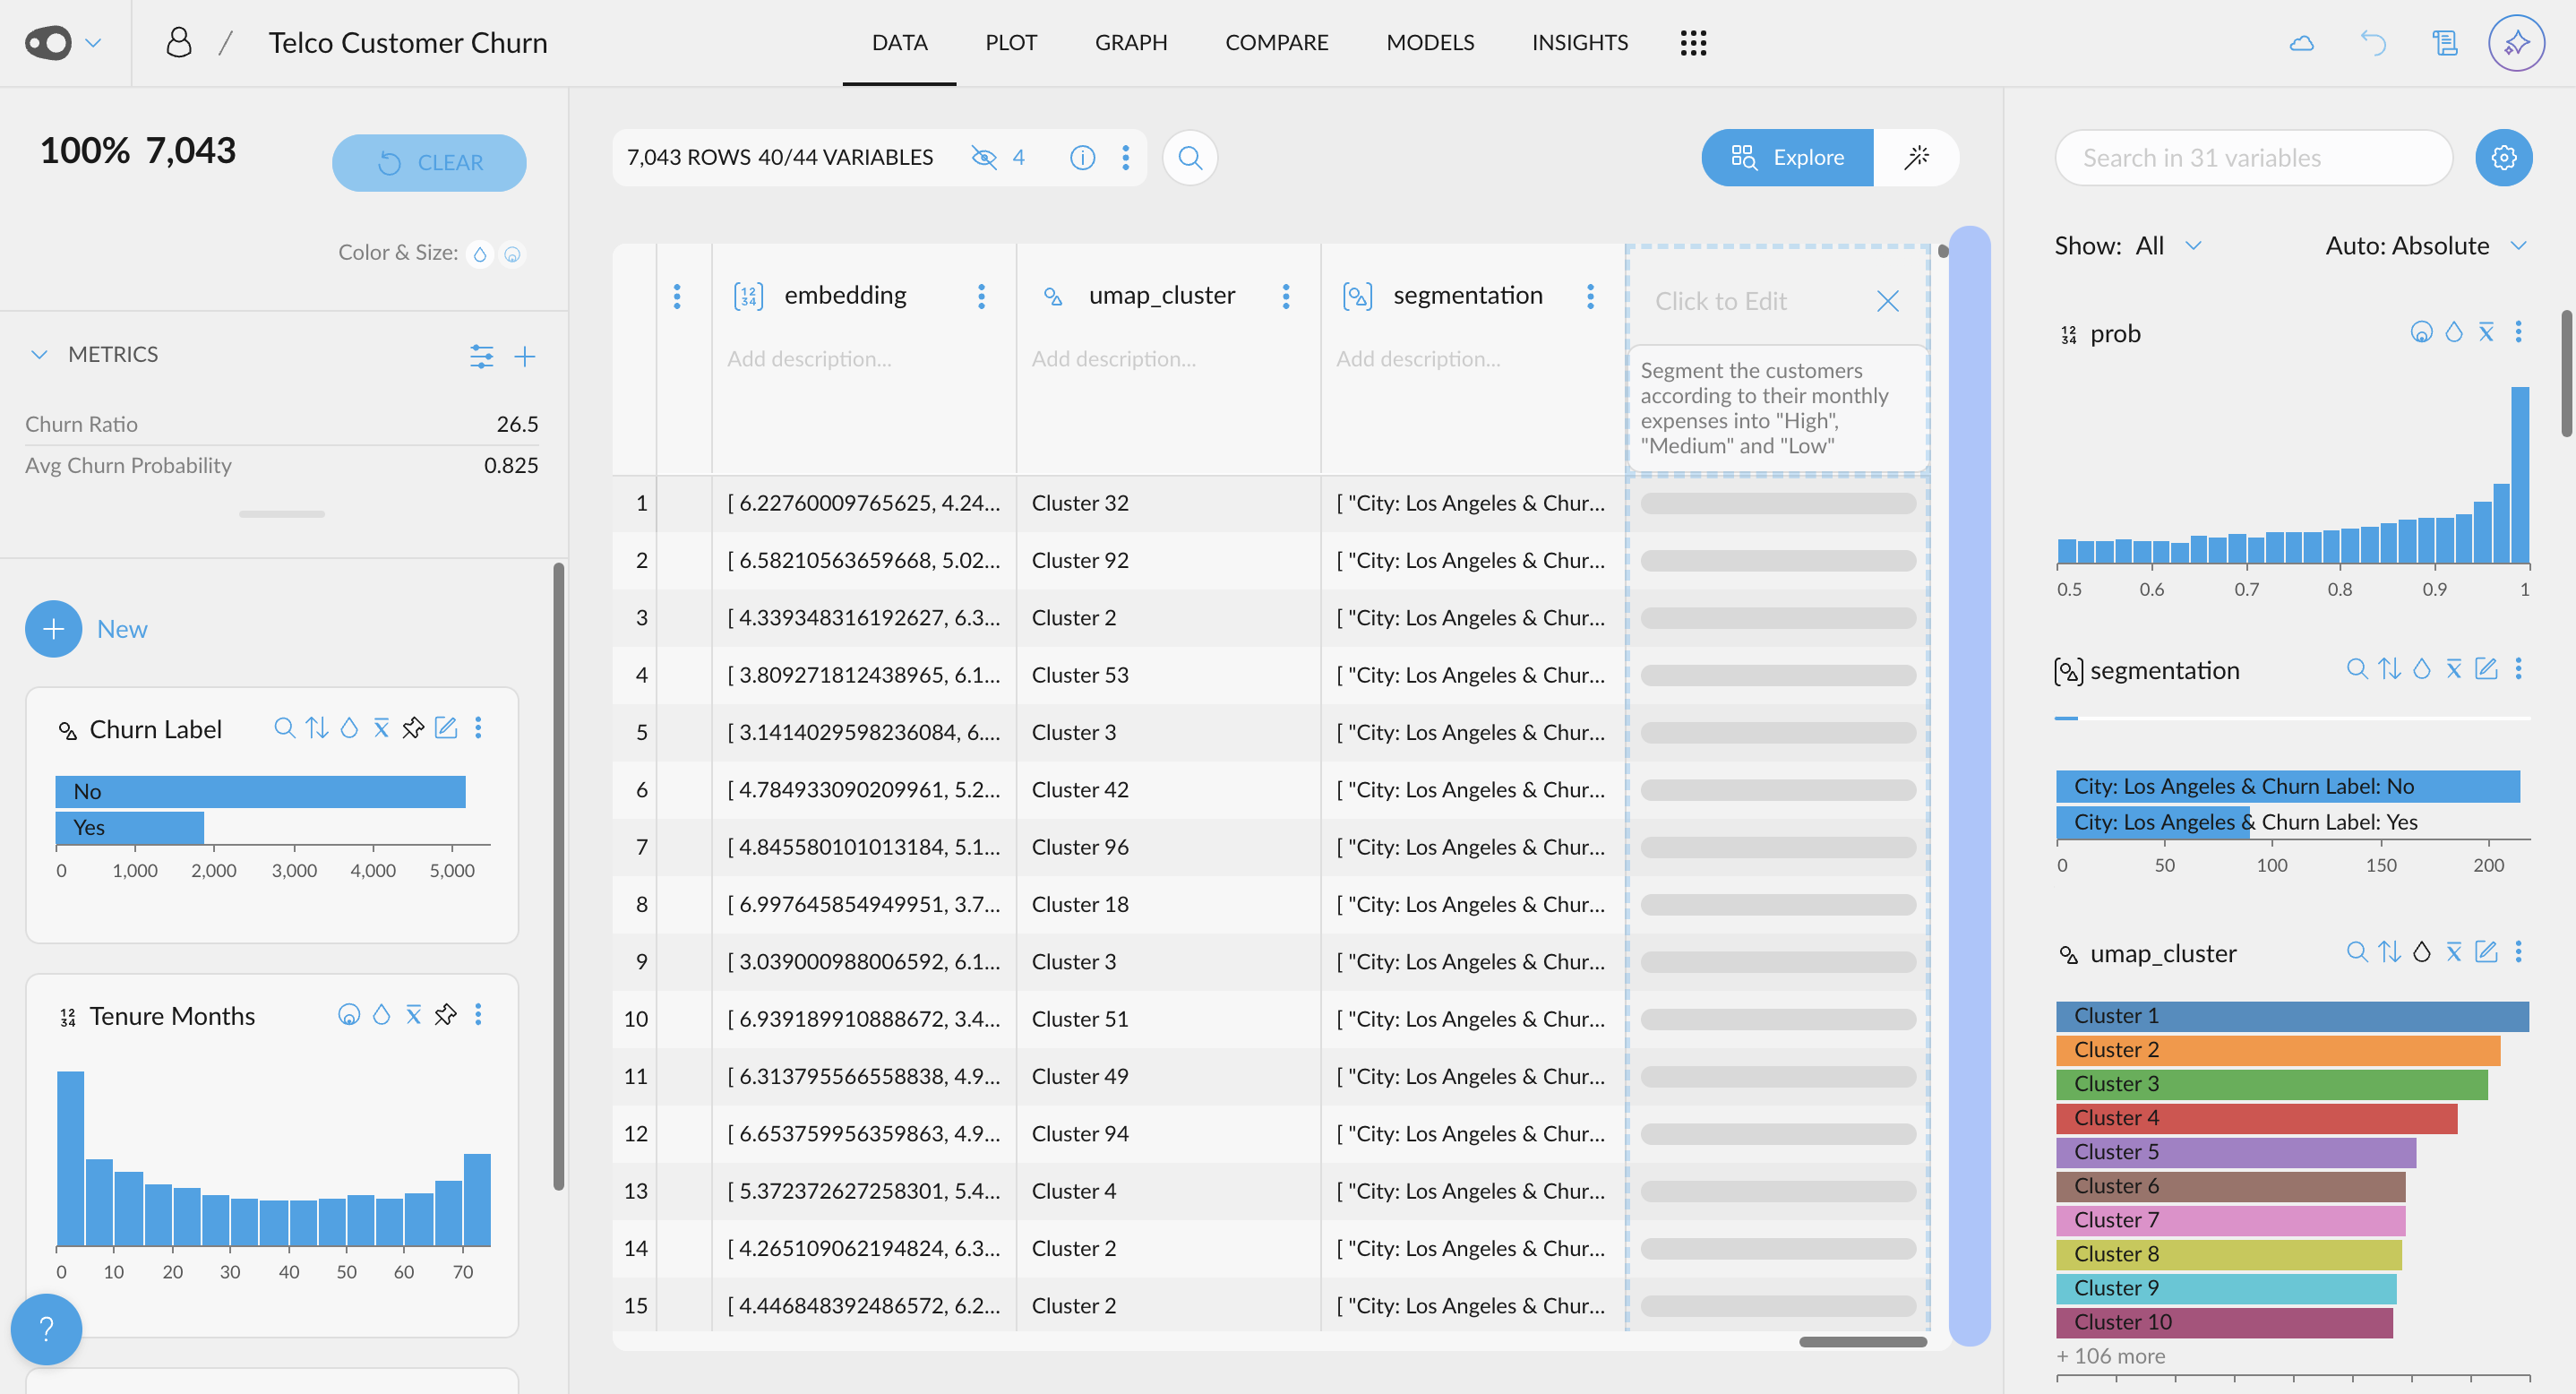
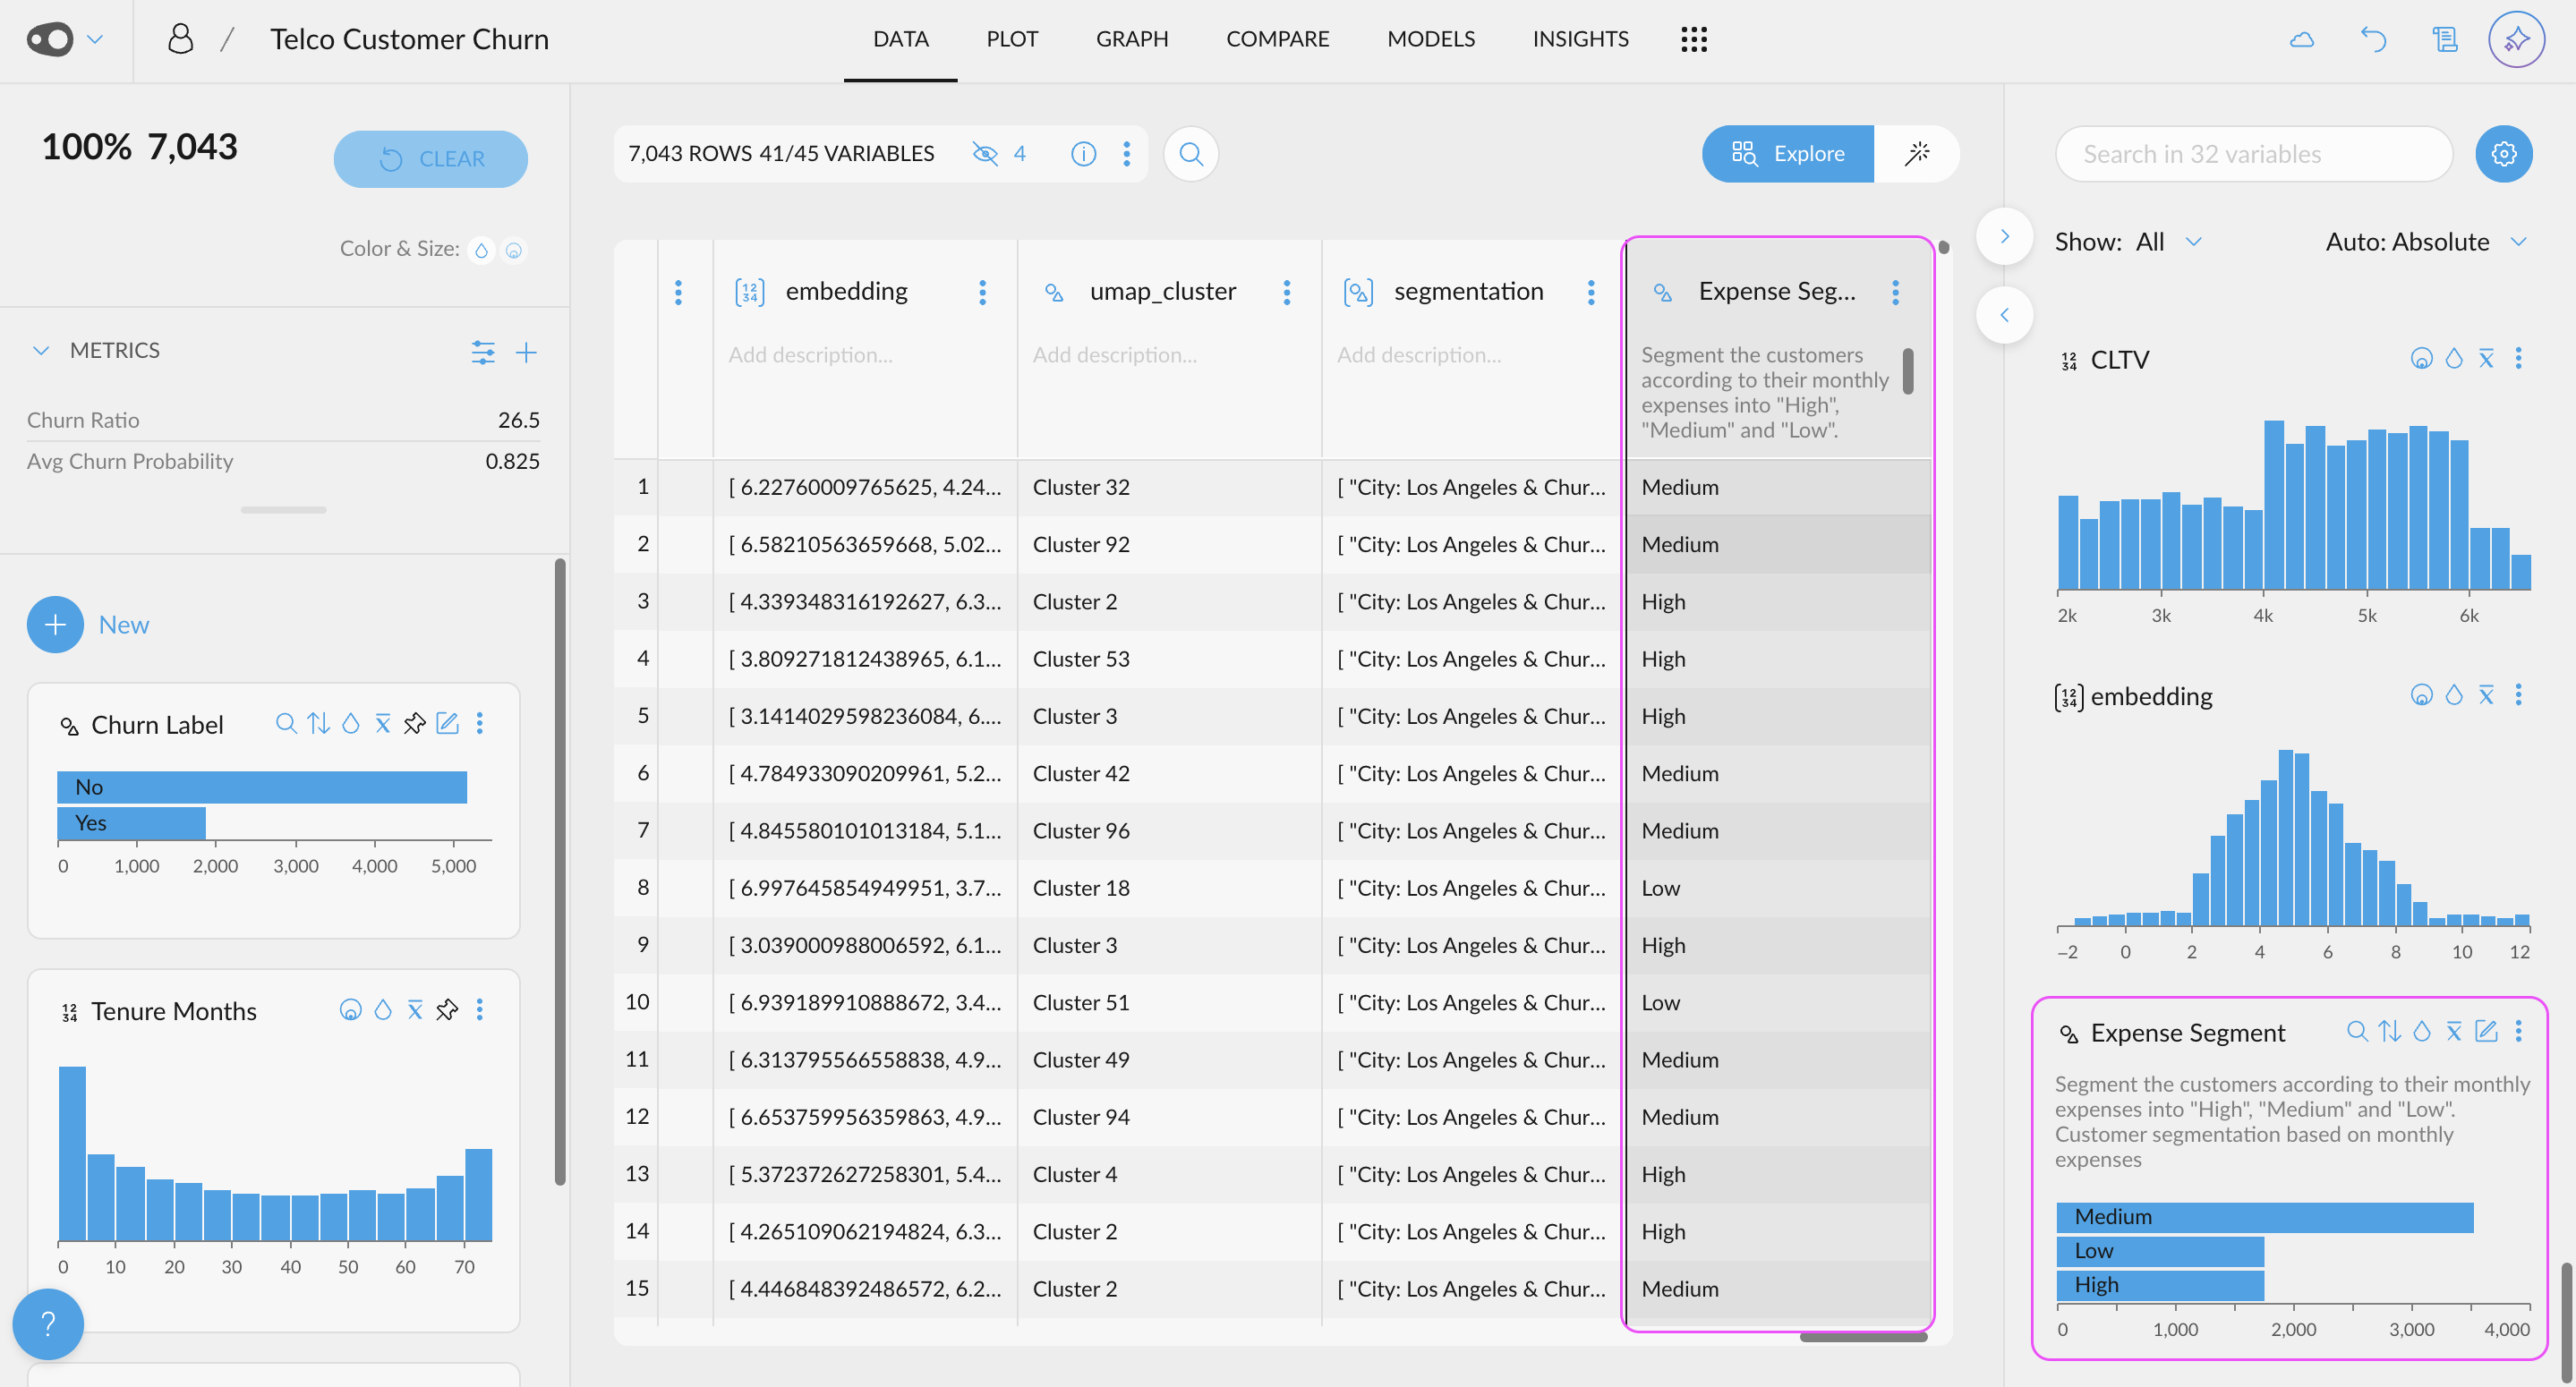
- New AI Enrichment UI: We've revolutionized data enrichment with AI through a new, optimized UI for data analysis. Now, you can leverage the power of LLMs using your OpenAI API key to automatically generate new columns—for example, classifying text as fact or opinion. You can also categorize content based on custom topics relevant to your business or use standard taxonomies like IAB. Once enriched, you can explore these new columns alongside your existing data—for instance, analyzing the main topics of negative reviews—to uncover deeper insights and trends.


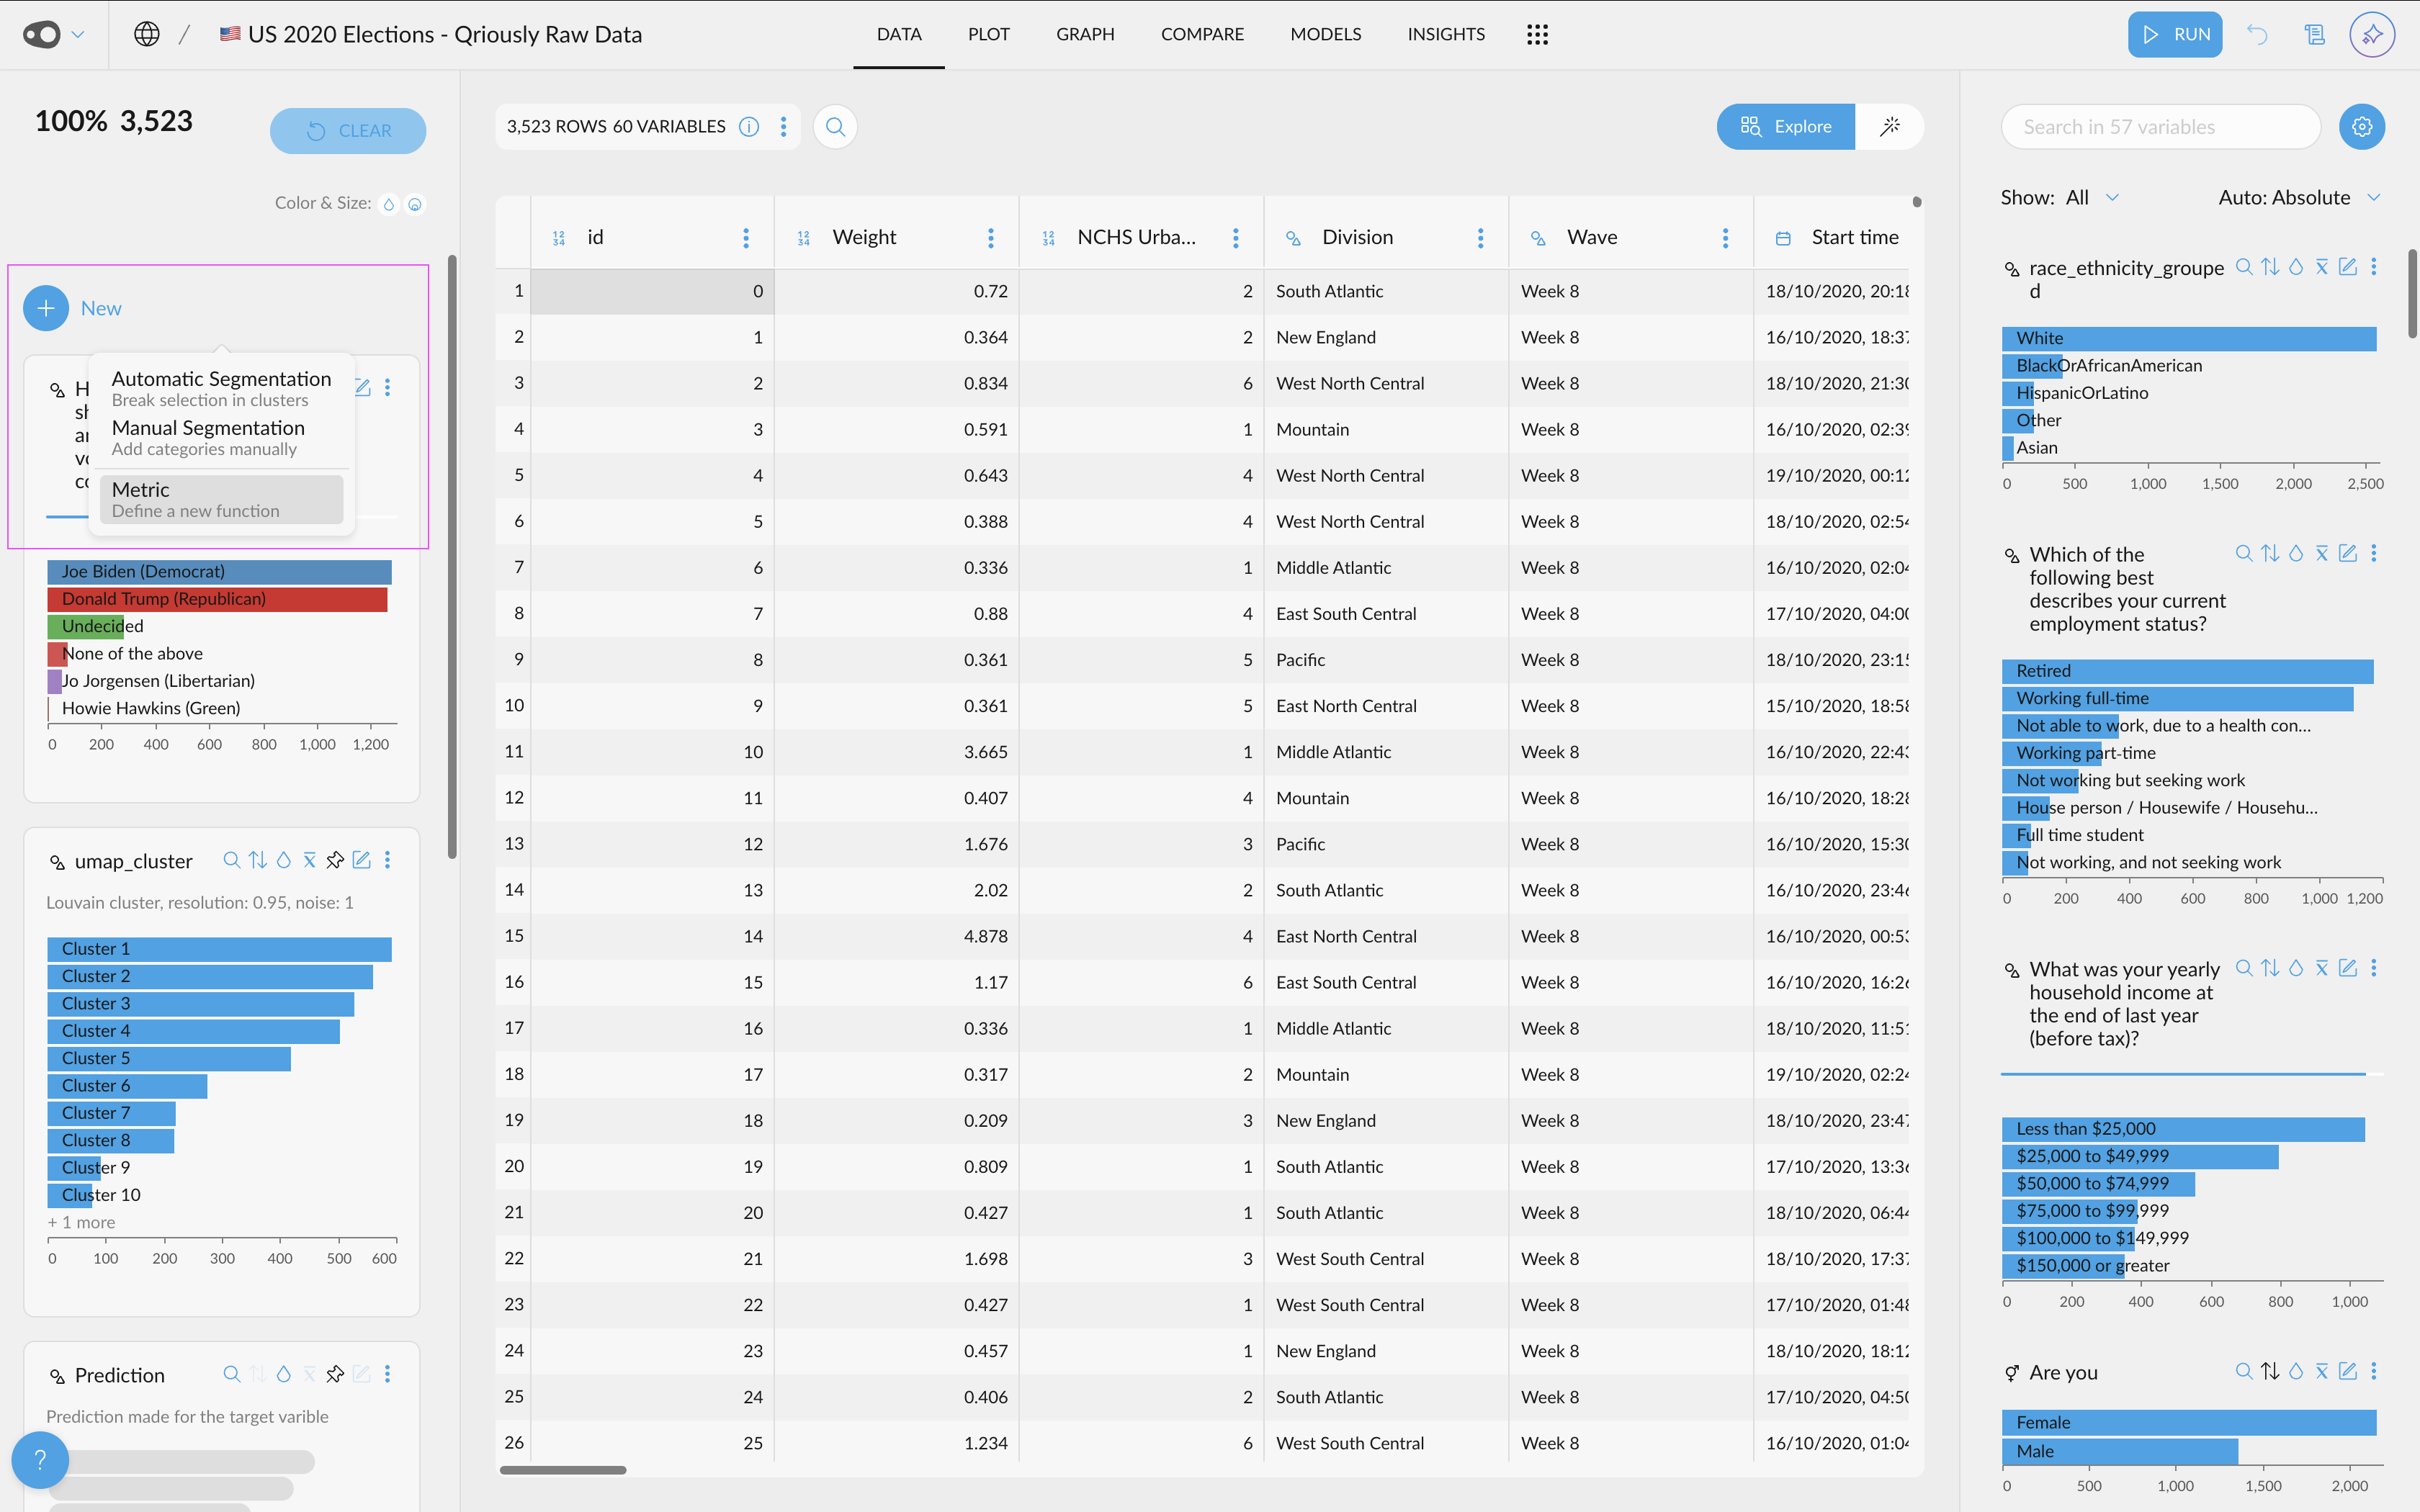
- AI-Powered Metric Creation. Use AI to generate metrics! Effortlessly generate new metrics from scratch, refine existing ones, and even create multiple metrics at once.


- Shap Values Visualization. If your project has a column with Shap Values (this can be done by adding the explain_predictions step to the recipe), you will be able to access their visualization.


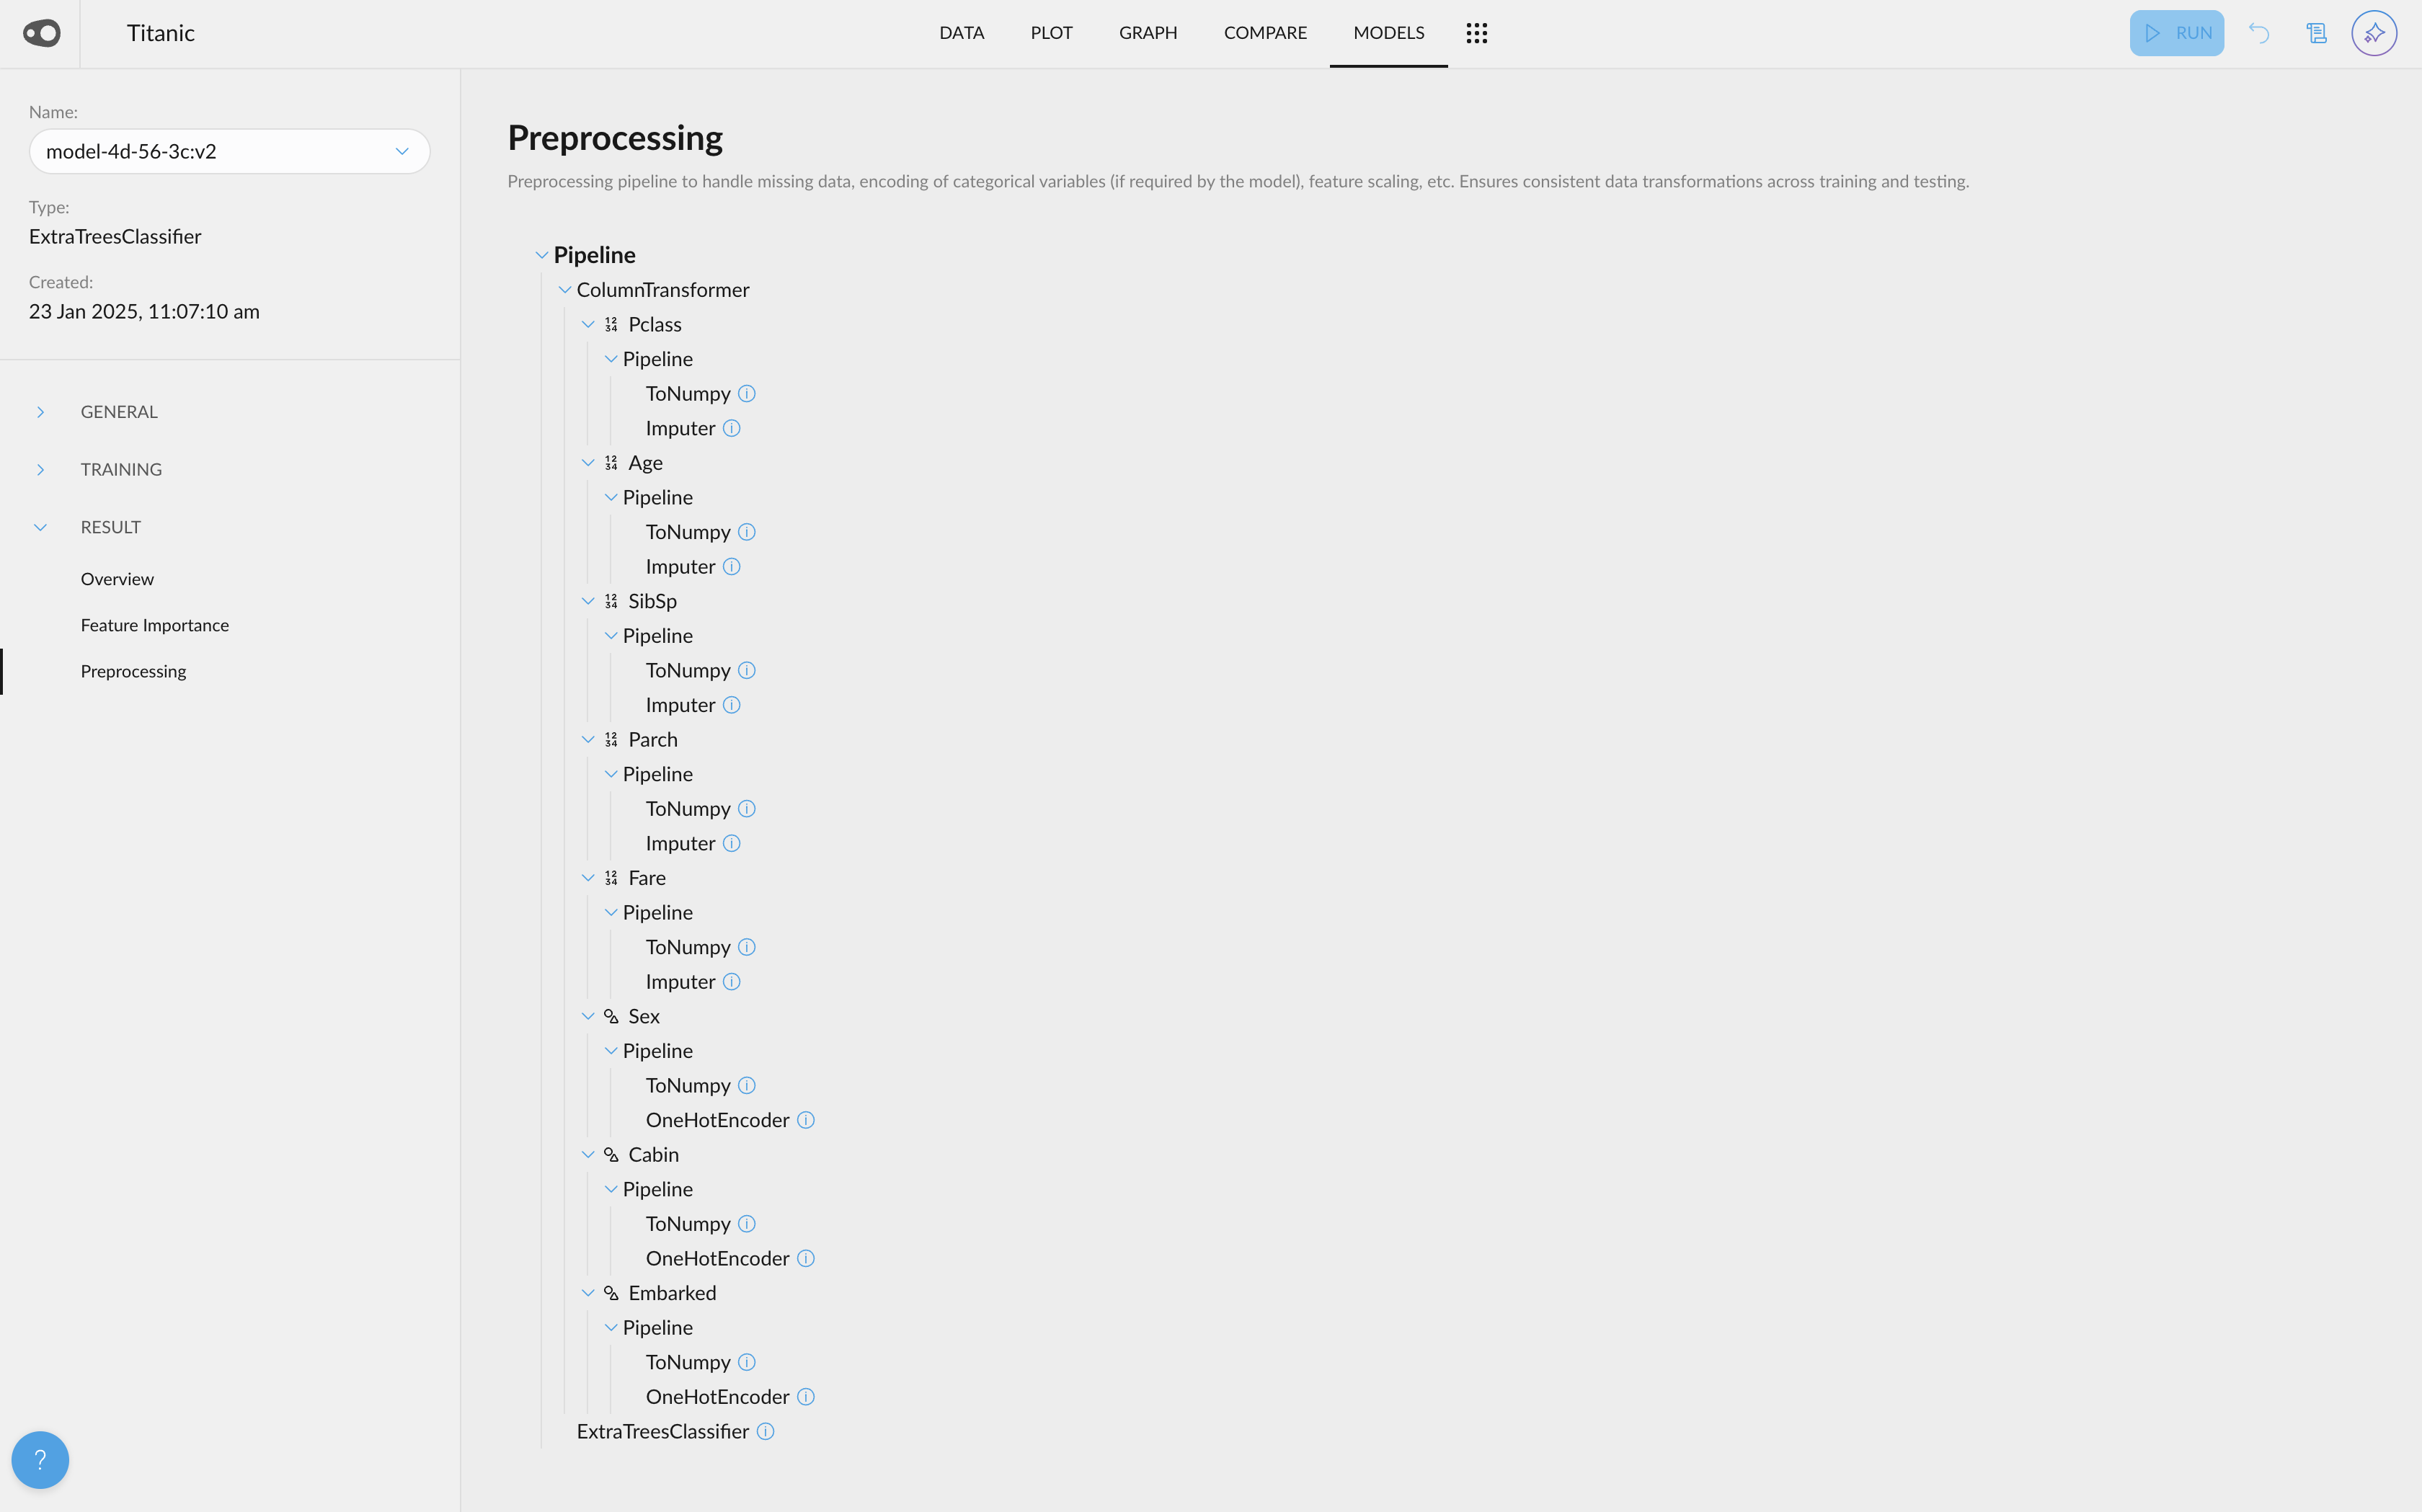
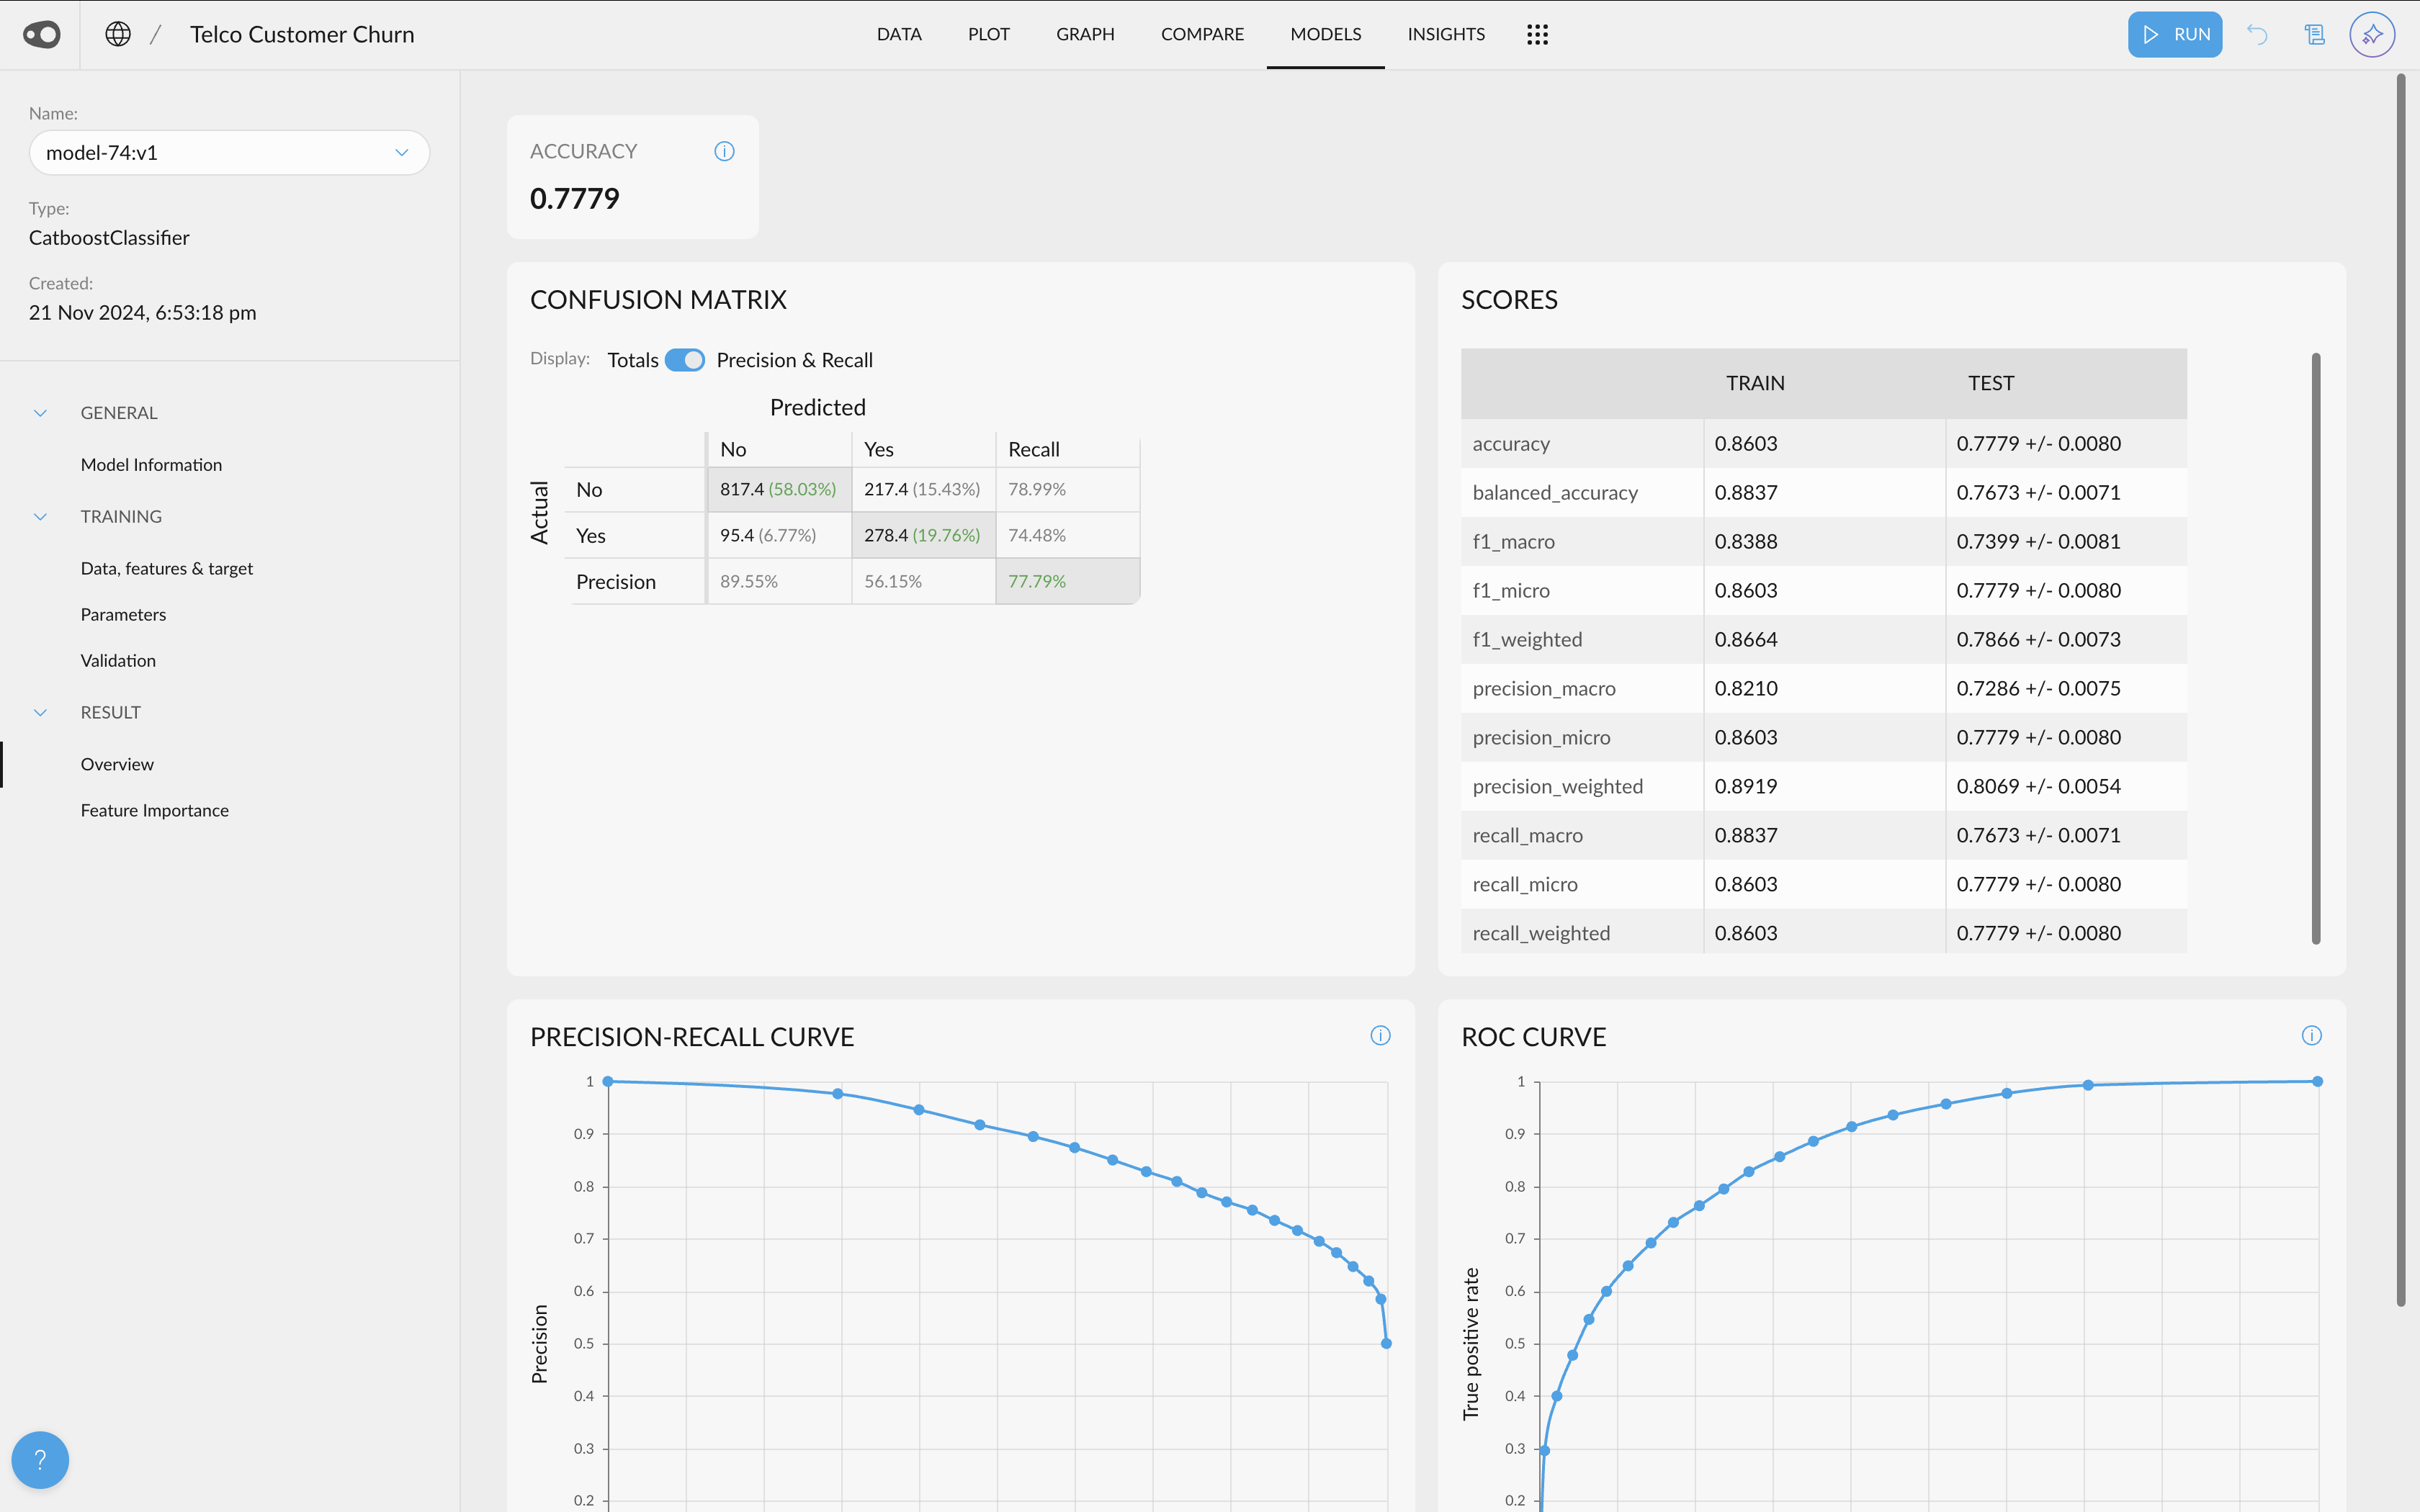
- Survival models and functions. You can now train Cox-proportional hazard models in Graphext and predict scalar values (median/expected/percentile survival duration) as well as whole survival functions (probability of survival over time). Adds steps to train and predict with survival models. Hazard models are also called time-to-event models, and estimate the risk or probability of an event happening at different points in time (think customer churn, time to signup etc.).

🛠️ Improvements
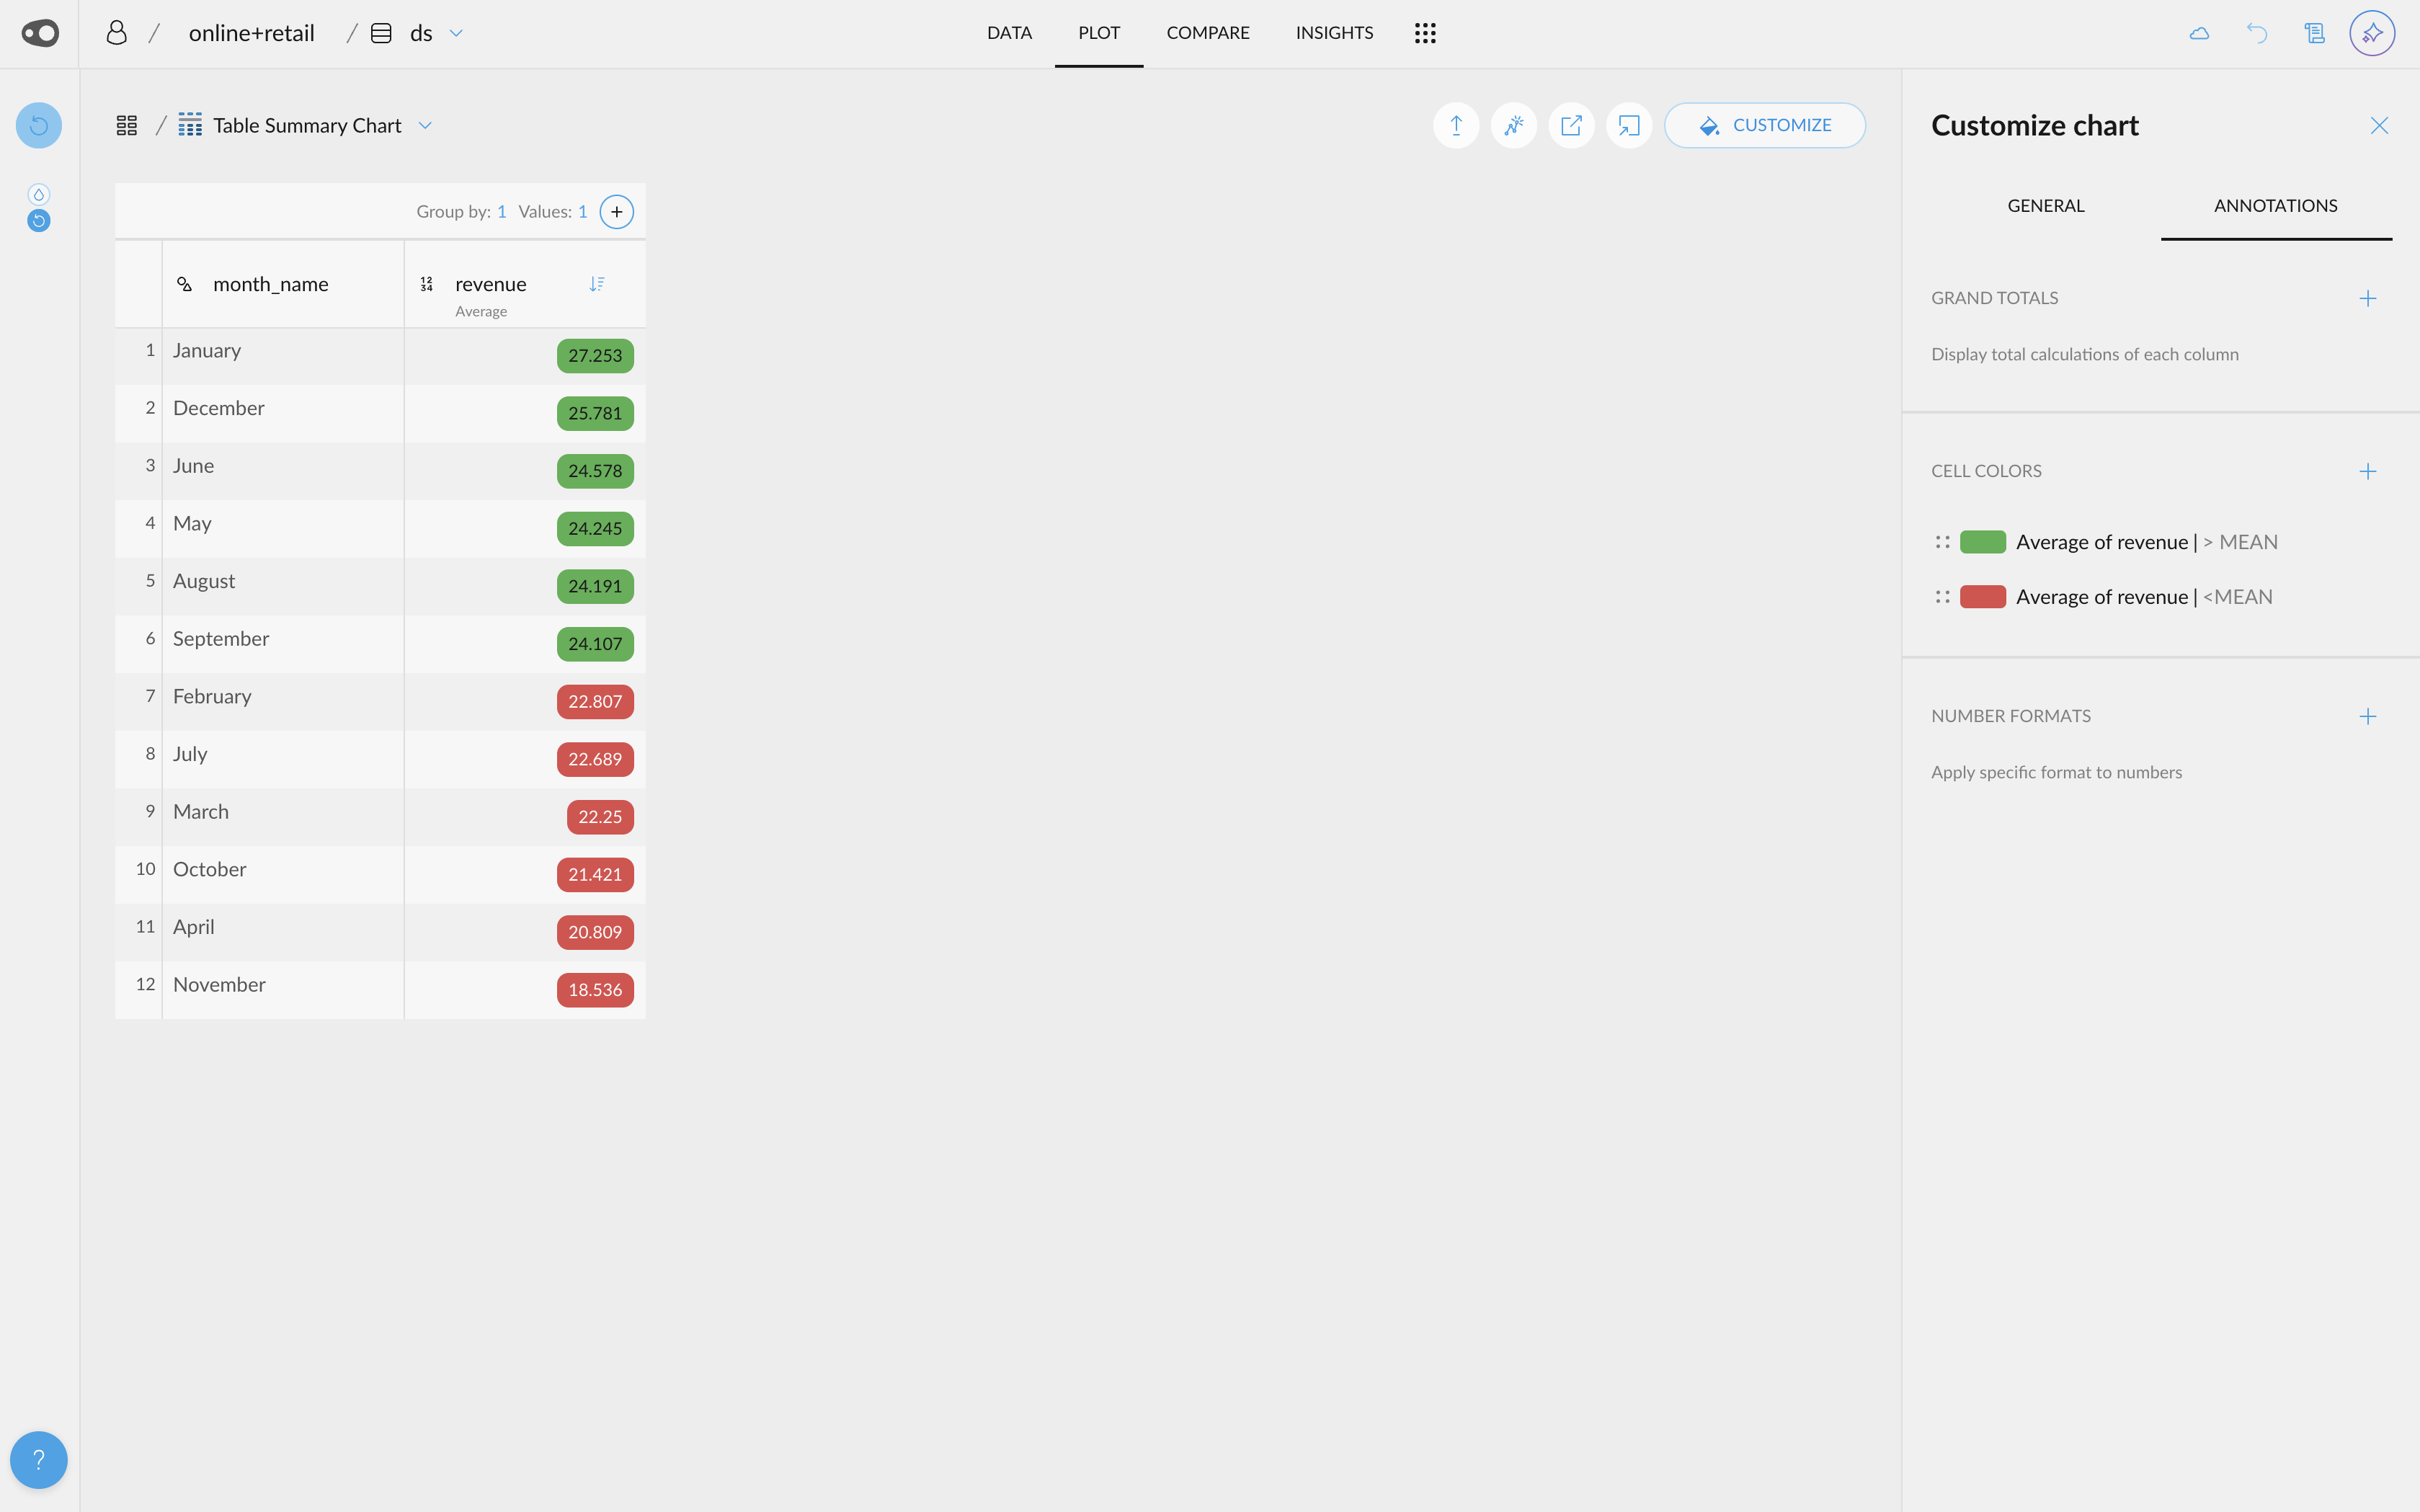
- New quantitative color palettes: You now have more options beyond the default Viridis and blue multi-hue palettes for visualizing quantitative data. Soon, you'll also be able to customize color schemes at the plot level, including divergent palettes like red-green for enhanced contrast and readability. Go to project settings in the top left corner.


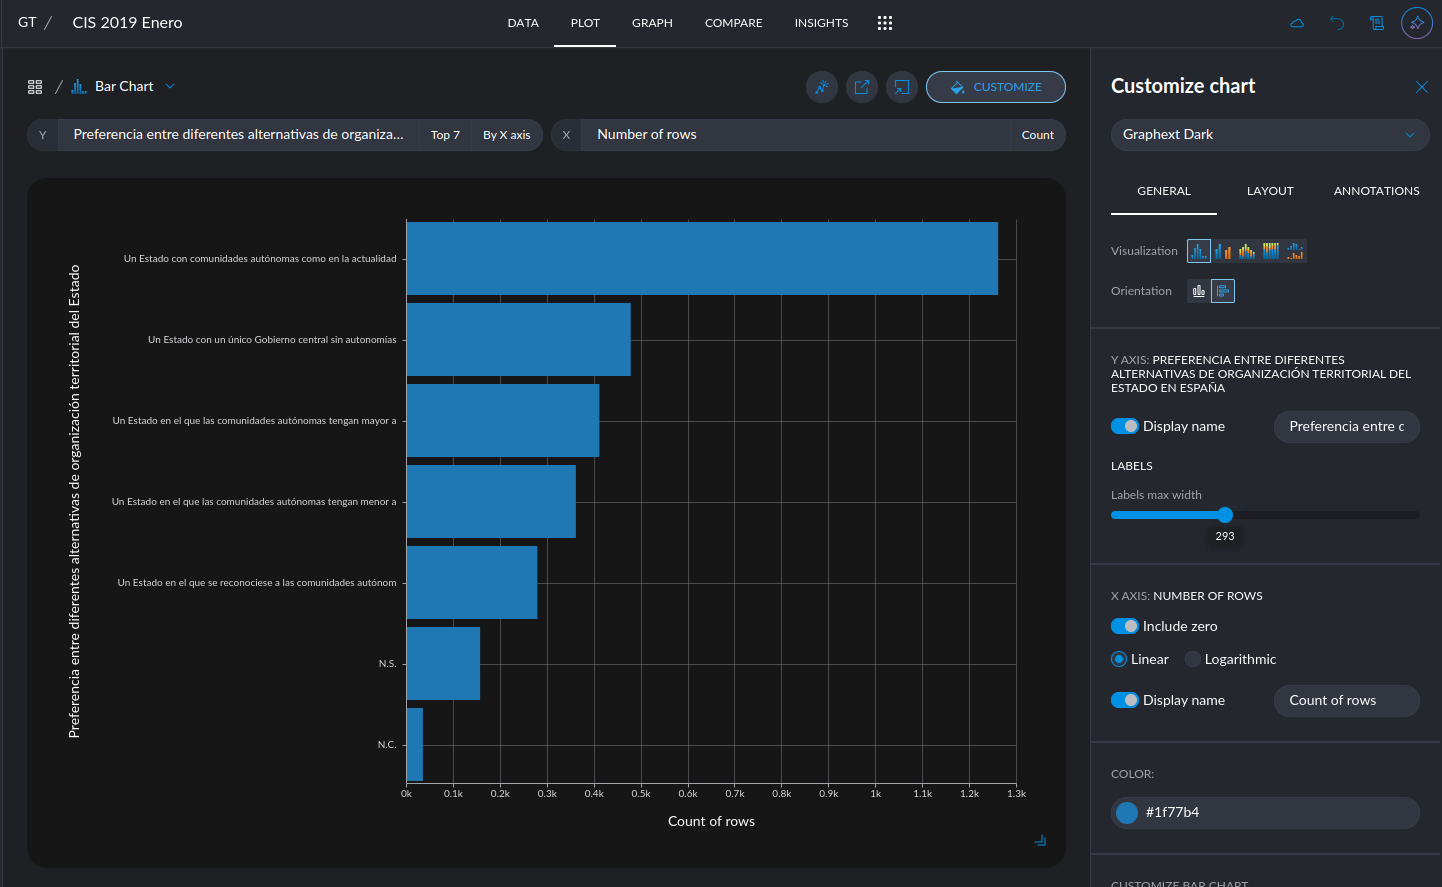
- Hide the grid: You can now give a cleaner look to your plots by removing the grid

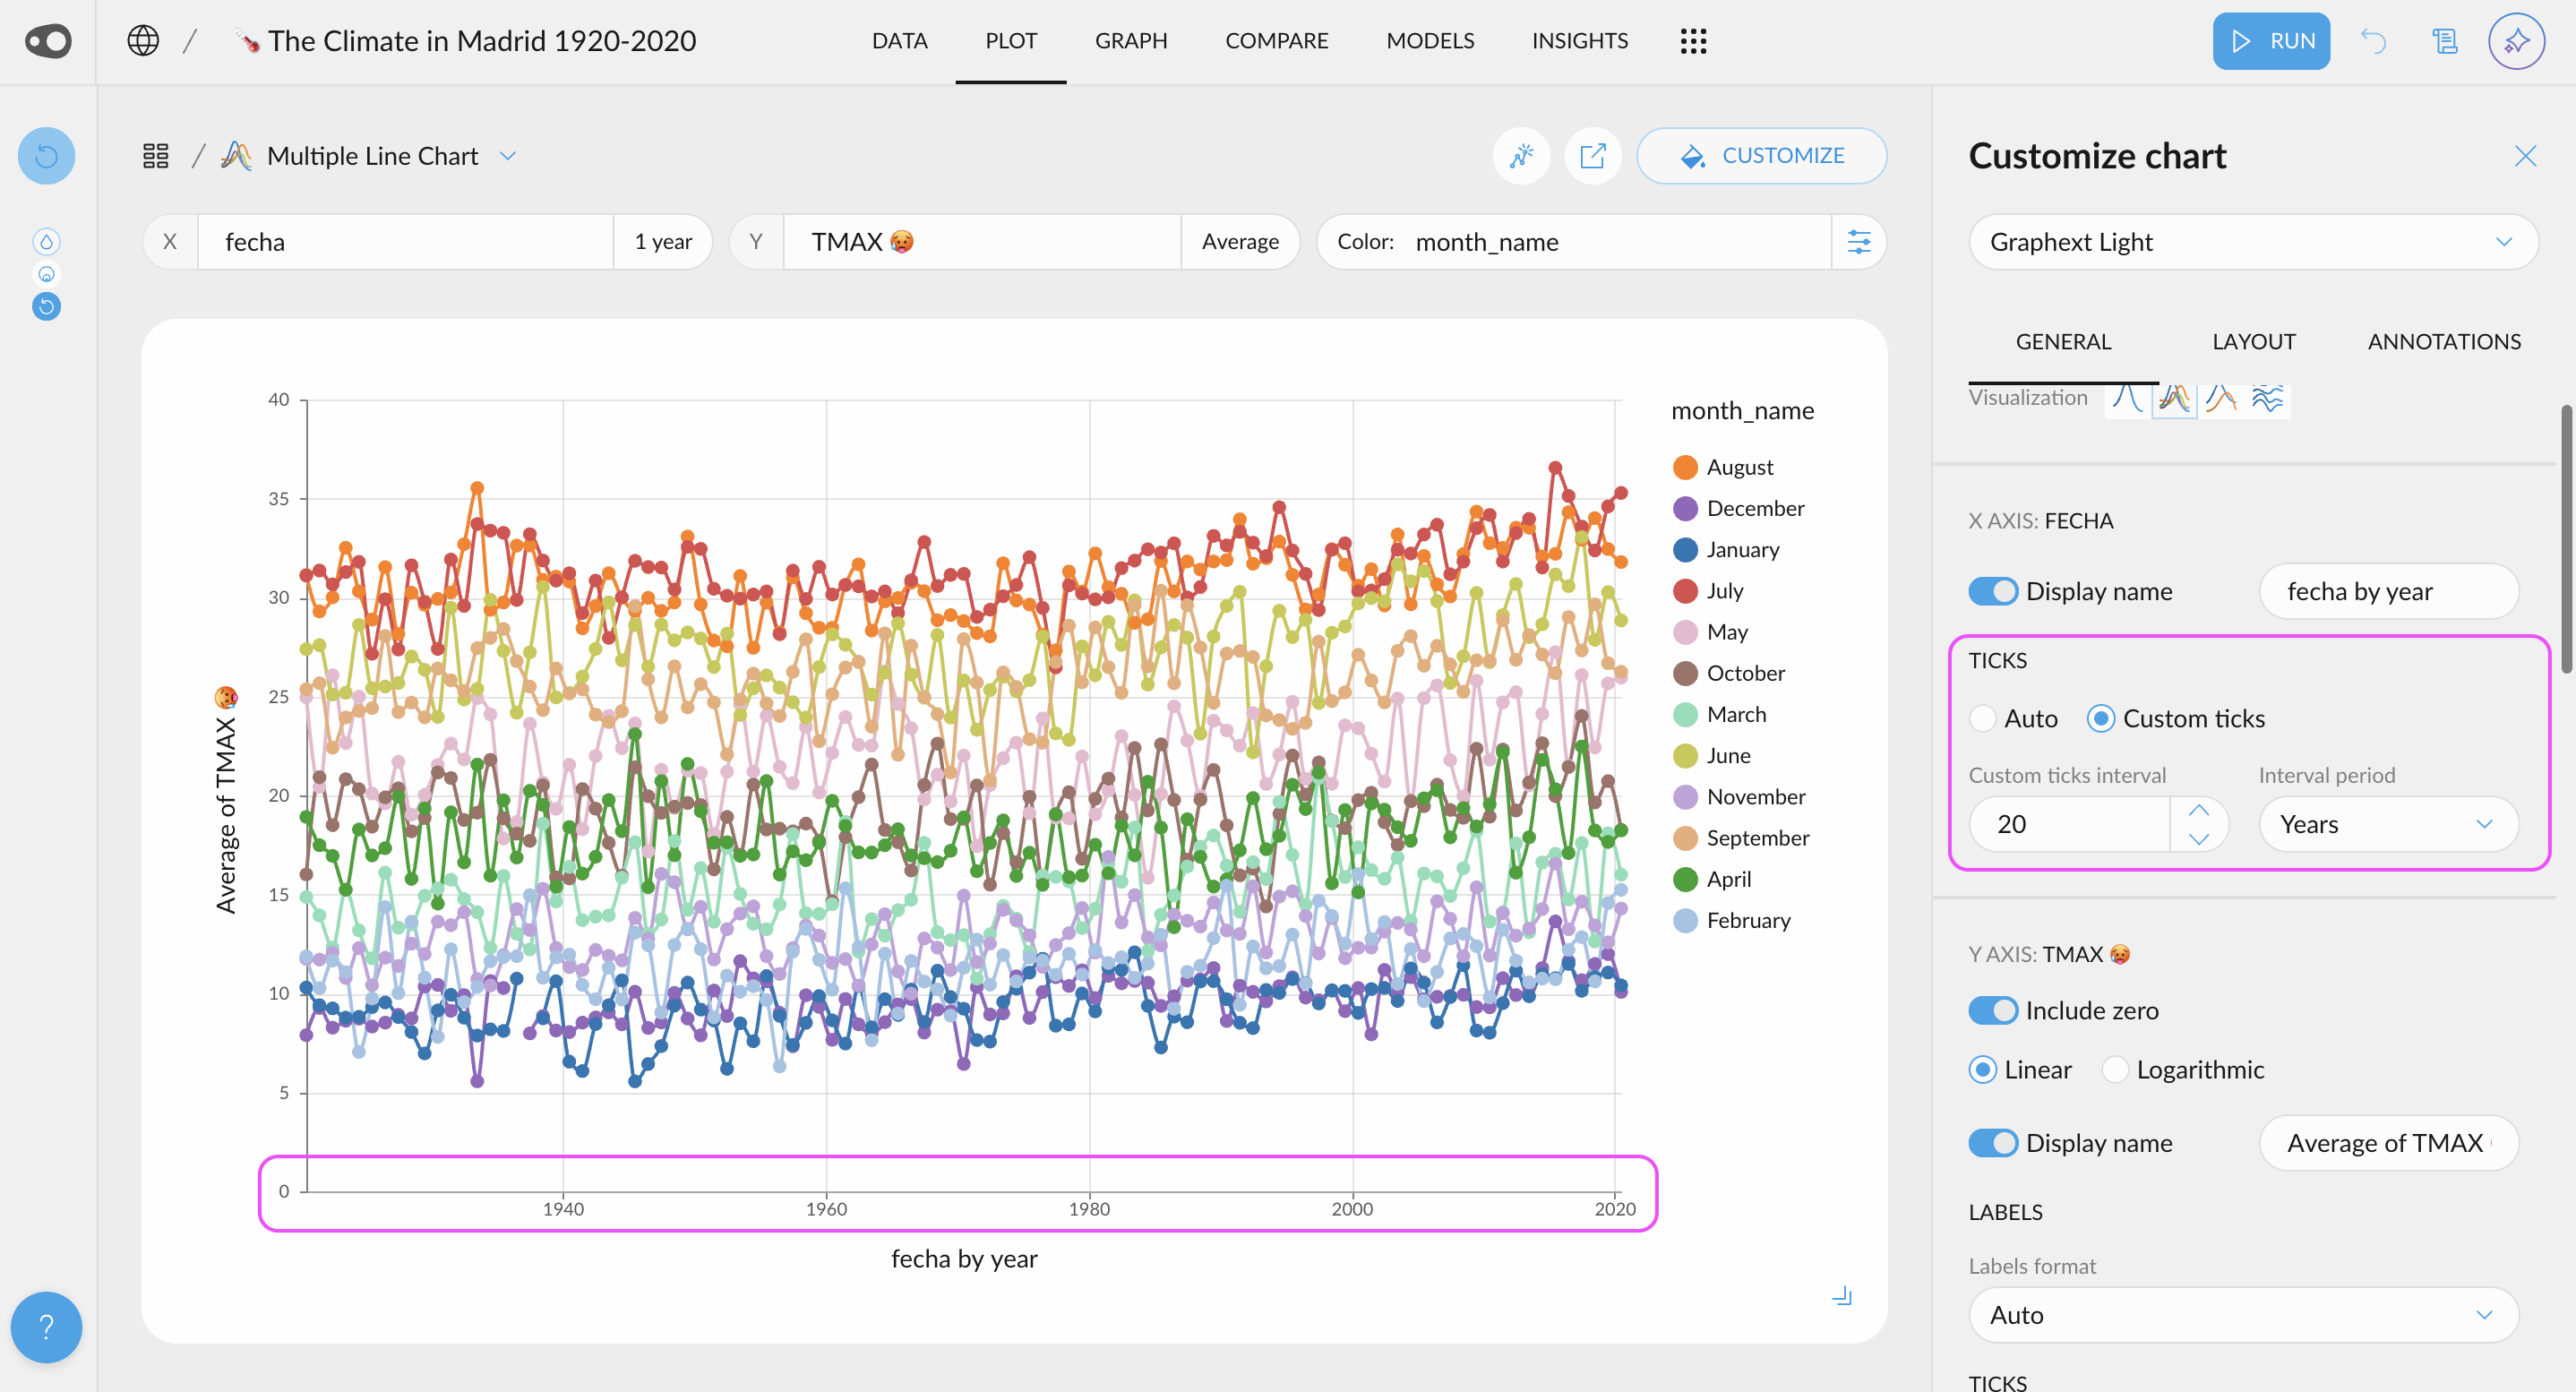
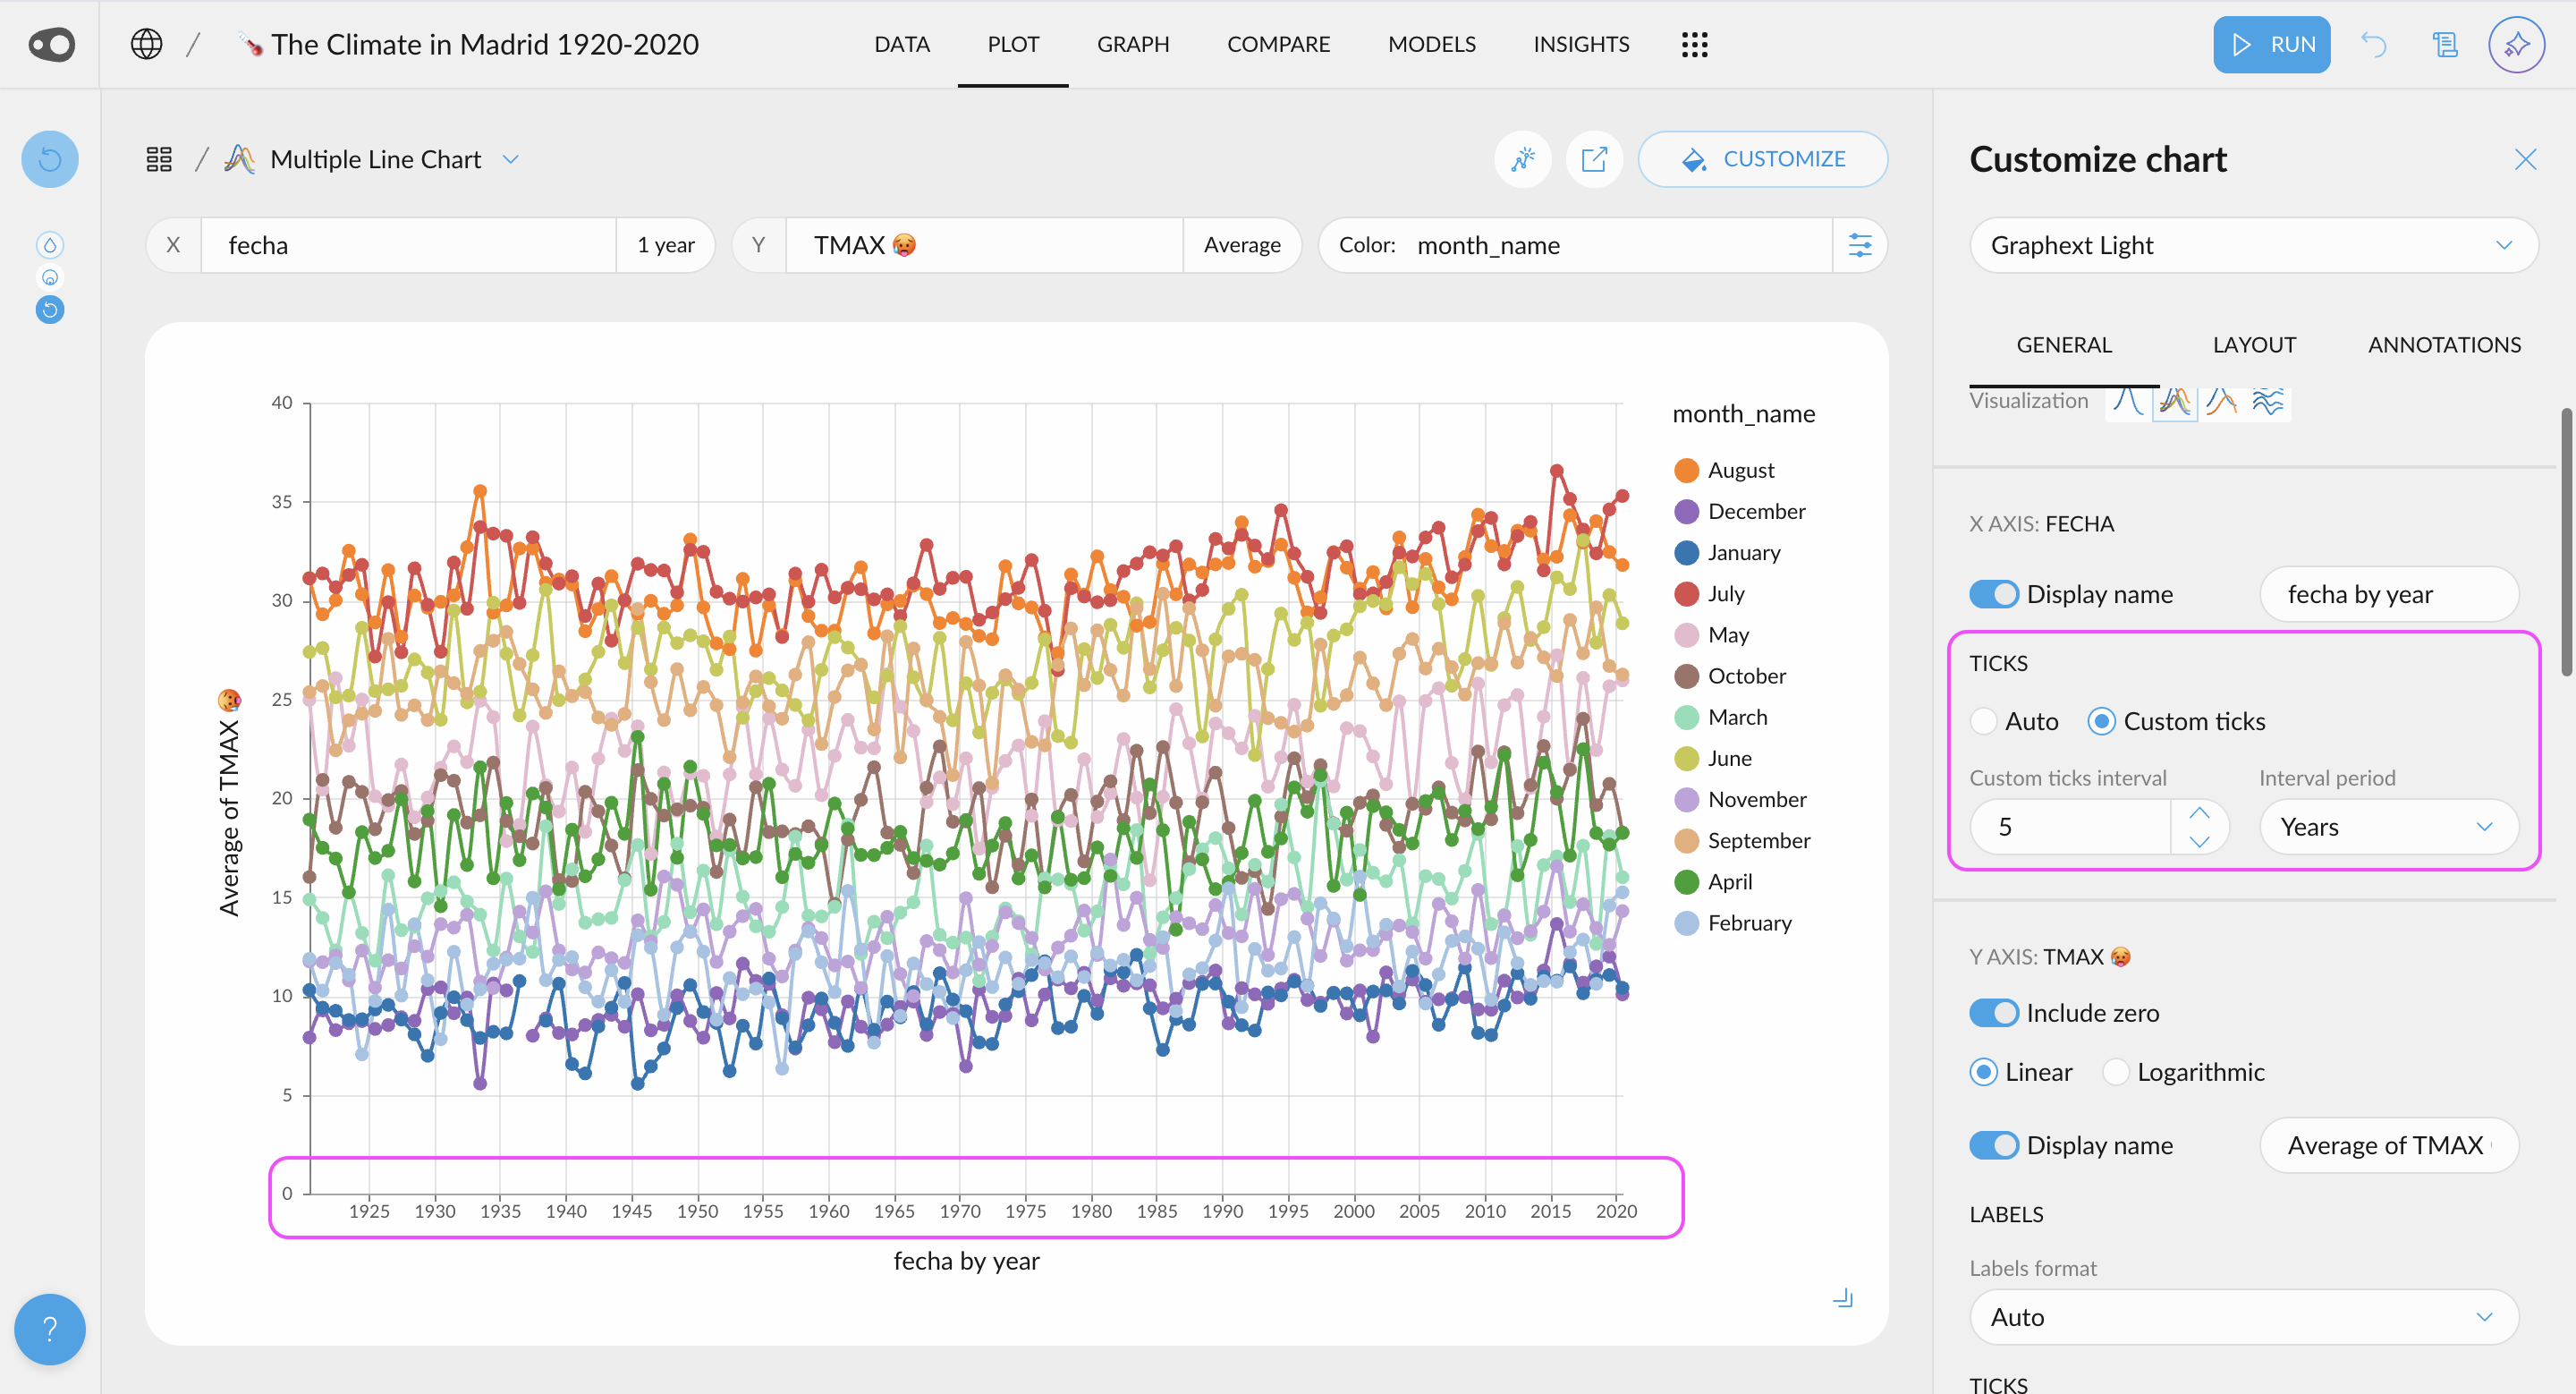
- Zoom in plot without filtering the data: You can now focus on a region of a plot


